
Chapter 2 · LV impedance · Case 3
LV impedance jump after an office visit
Patient and episode
Patient
- VISIONIST X4 CRT-P with a quadripolar LV lead; DDD 50-120 bpm, BiV pacing (99-100%), LV offset 0 ms; atrial and RV outputs in Trend (daily thresholds), LV output fixed
- The latest LATITUDE remote report, almost 4 weeks after an office visit (the first since the check just after implant), shows an LV impedance jump; the report 11 weeks earlier, 33 months after implant, follows. Is the lead failing?
The recording
Tap a number on the trace, or an entry in the list below
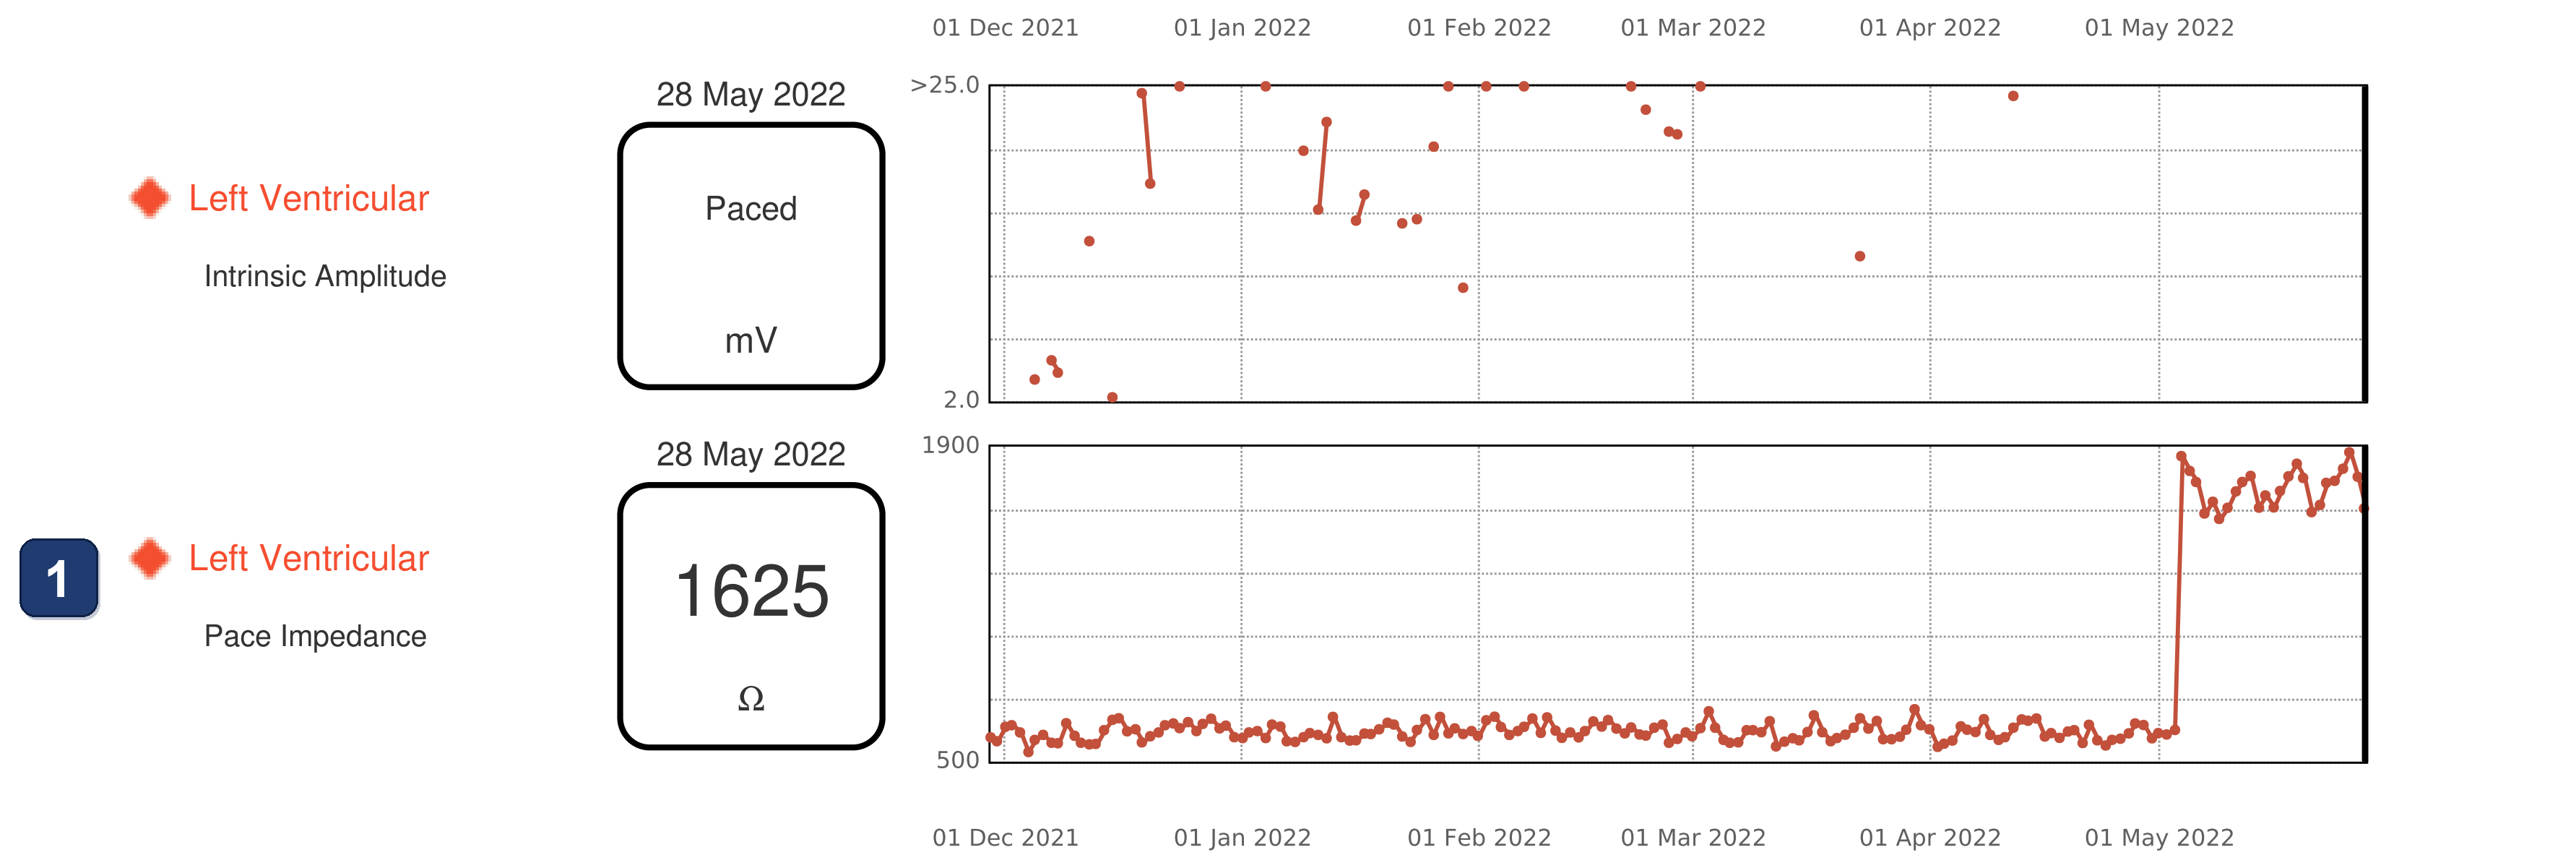

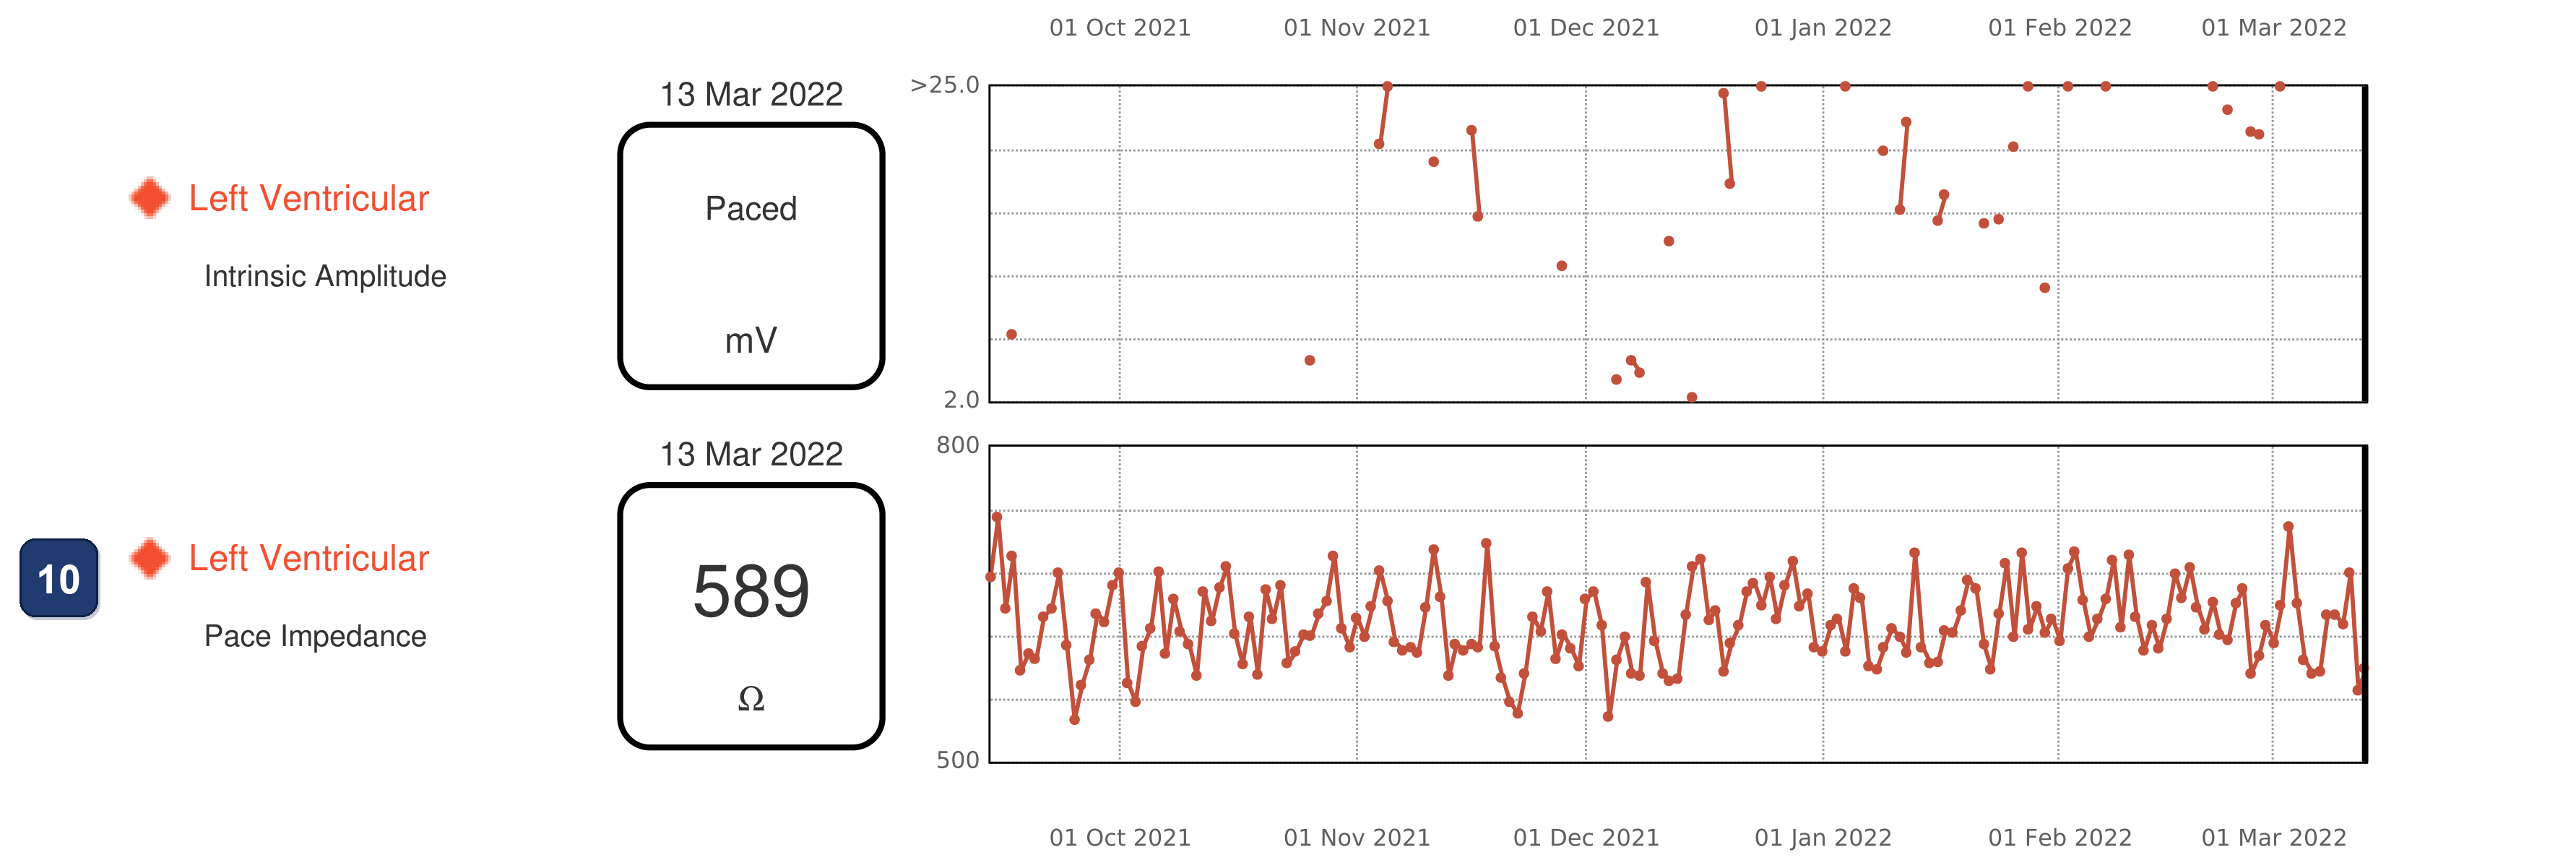
- The latest report: LV pace impedance, one value a day over 6 months (vertical lines: the 1st of each month): 550-740 Ω up to the office visit, then 1580-1870 Ω from the next day on, stable. A step on the day of the visit (the trend graphs mark P, Program, and I, Office Interrogation, that day), not a drift. Above, the LV intrinsic amplitude has almost no values (“Paced”): the LV is paced on nearly every beat
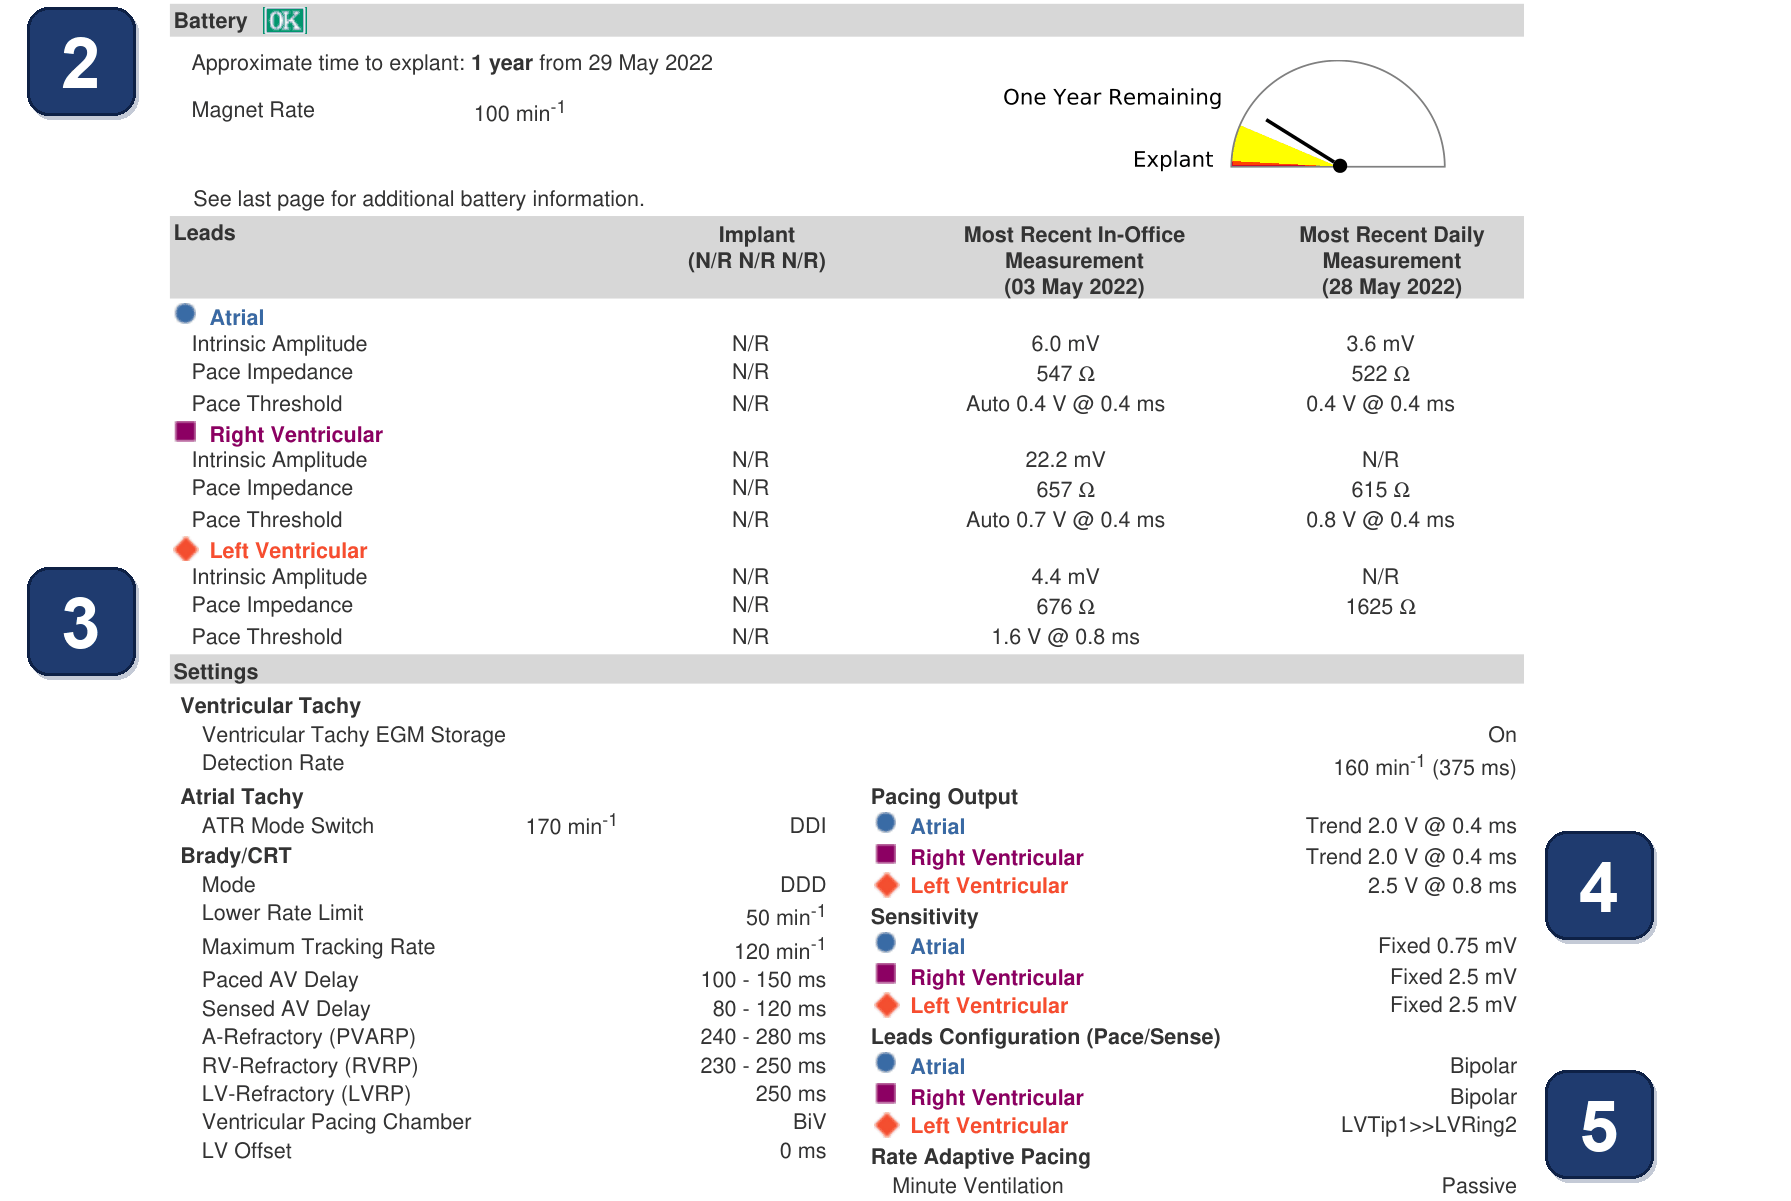
- Battery: about 1 year to explant. The last page gives the power use: 49 µW, 92% of a reference CRT (RV and LV paced 100% at 2.5 and 3.5 V @ 0.4 ms)
- At the office visit: LV threshold 1.6 V @ 0.8 ms; pace impedance 676 Ω in office, then 1625 Ω on the last daily measurement. The atrial and RV values have not changed
- Pacing Output, Left Ventricular: 2.5 V @ 0.8 ms, 0.9 V above the threshold
- Leads Configuration, Left Ventricular: LVTip1>>LVRing2, the LV paced between the tip and ring 2, the bipole it also uses for sensing
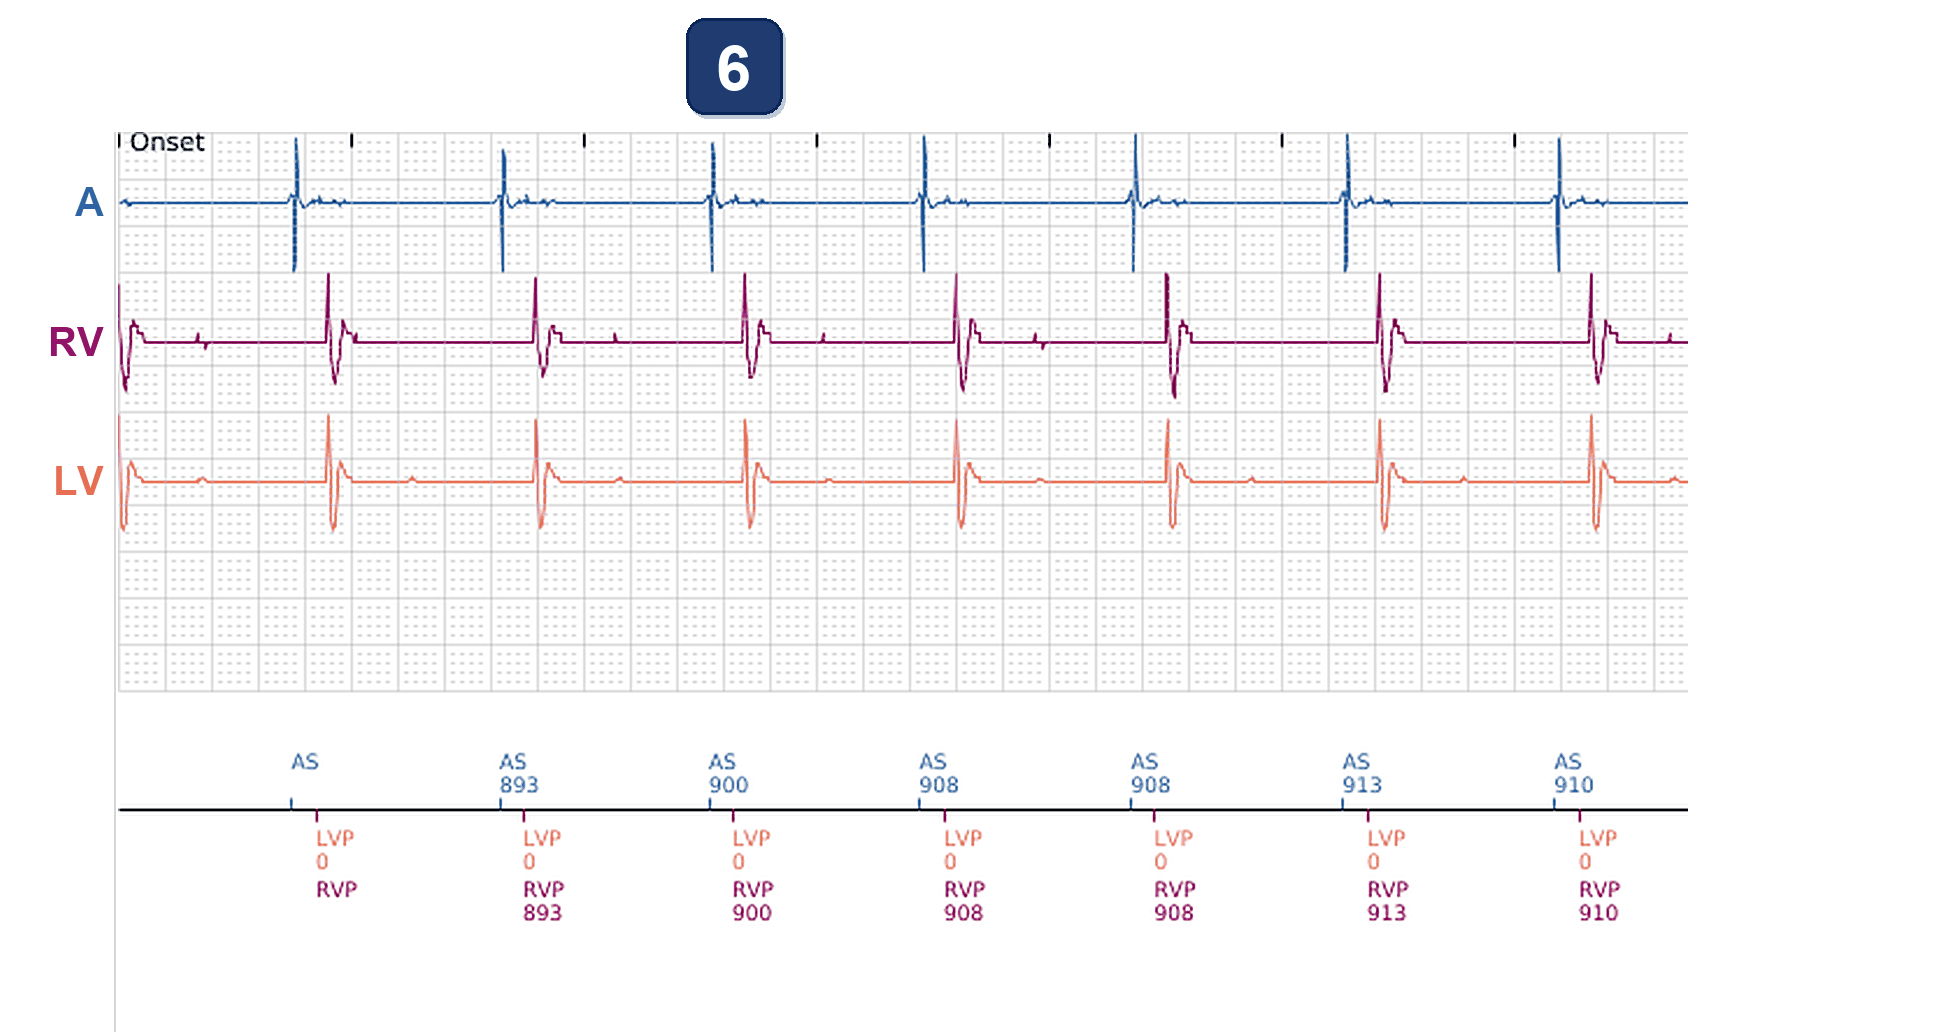
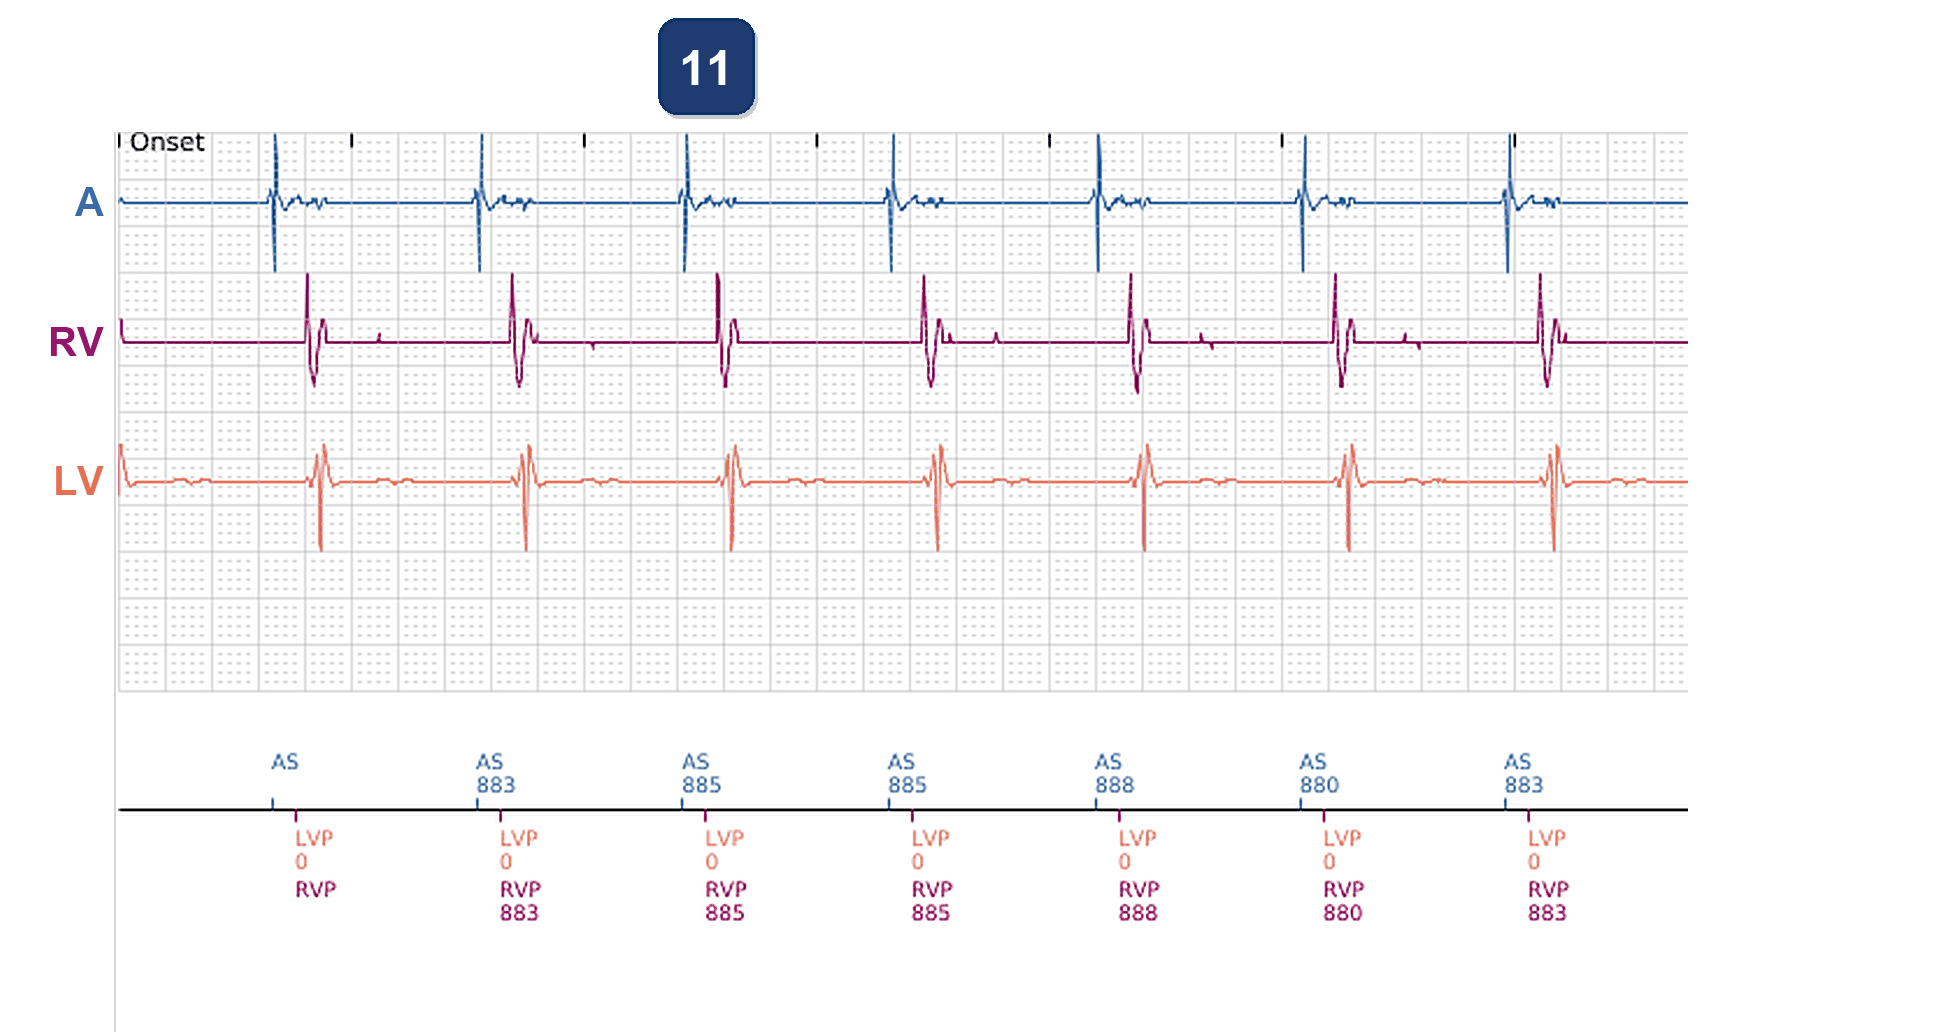
- Presenting EGM of the latest report: sinus rhythm at about 67 bpm (AS 893-913 ms), each atrial sensed event tracked and both ventricles paced together (LVP 0, RVP): normal BiV pacing and capture on every beat
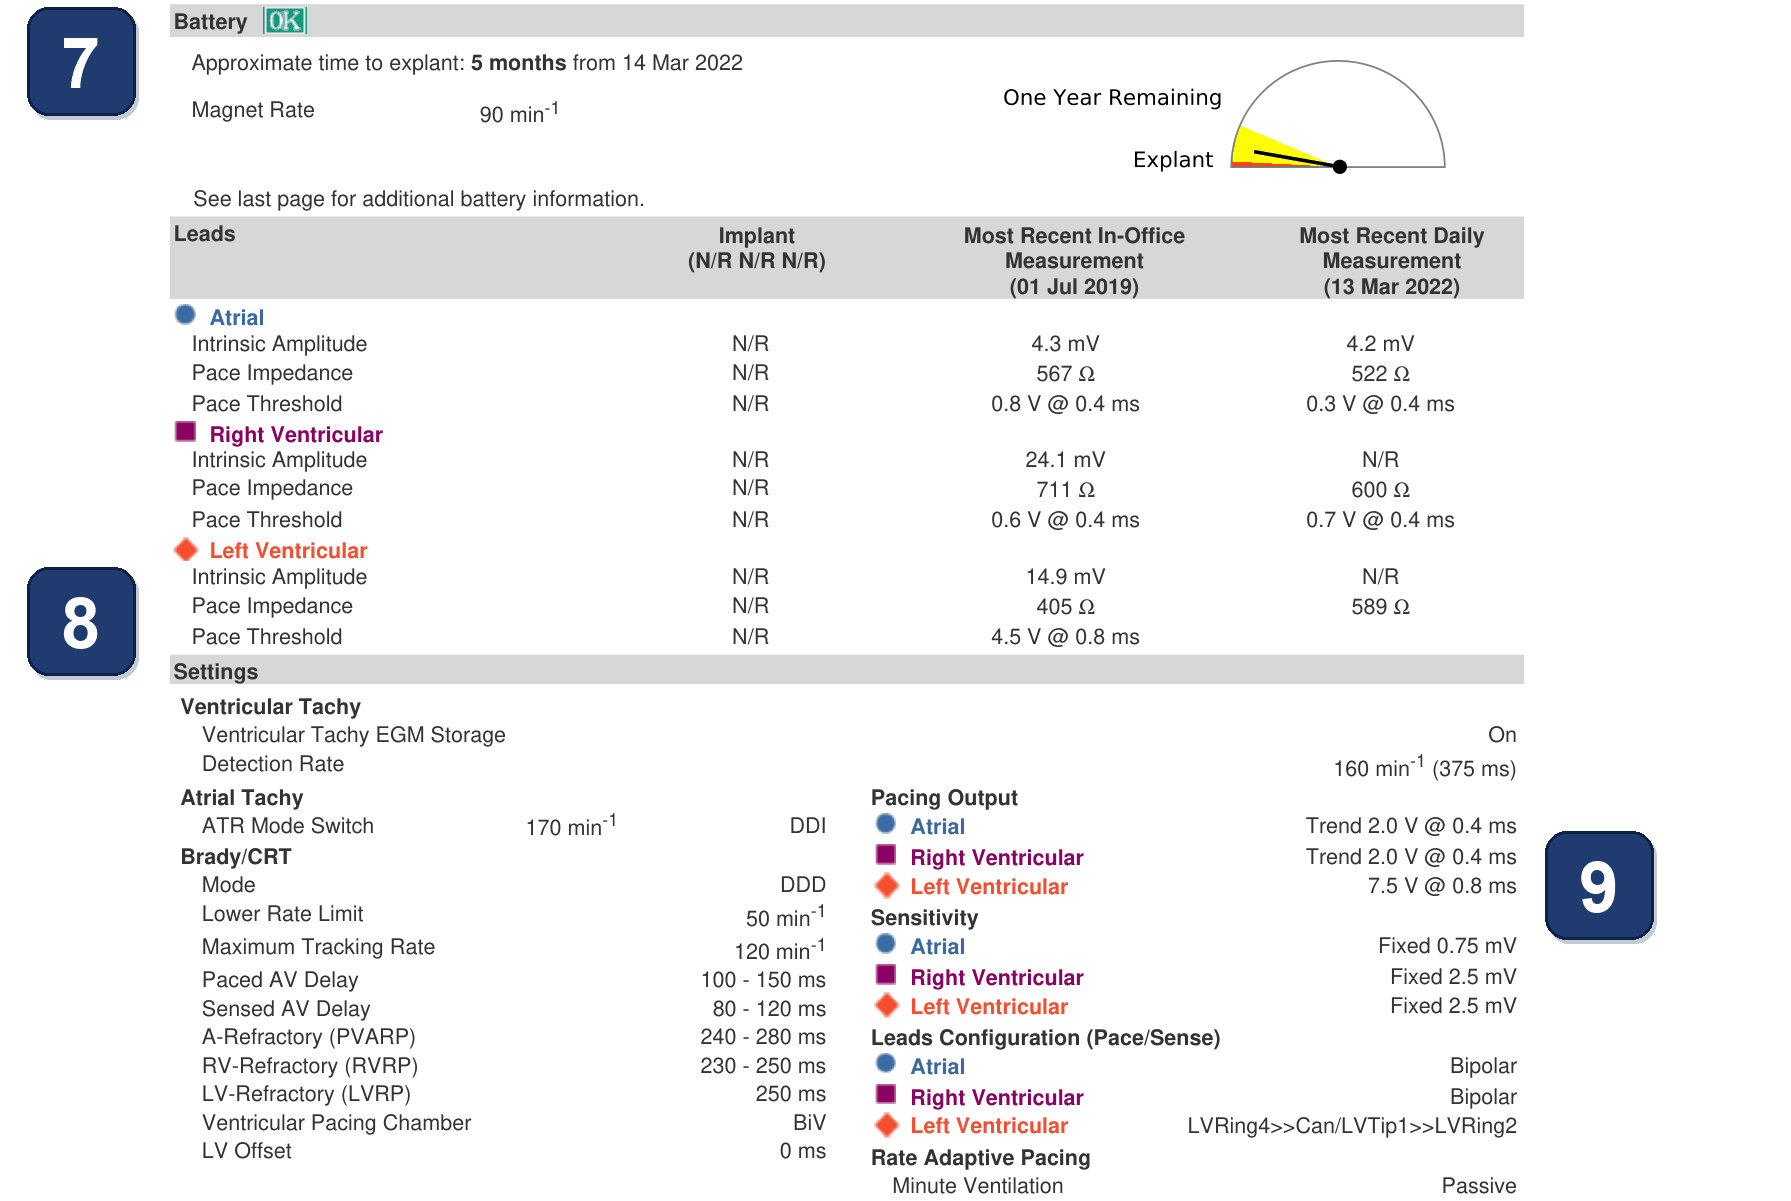
- Eleven weeks earlier, the first report, 33 months after implant: about 5 months to explant (the needle is close to Explant); power use 151 µW, 282% of the reference
- LV lead: pace impedance 405 Ω at the office check just after implant and 589 Ω on the last daily measurement; LV threshold 4.5 V @ 0.8 ms, measured at that check: with a fixed output the report gives no daily LV threshold. The atrial and RV values are normal
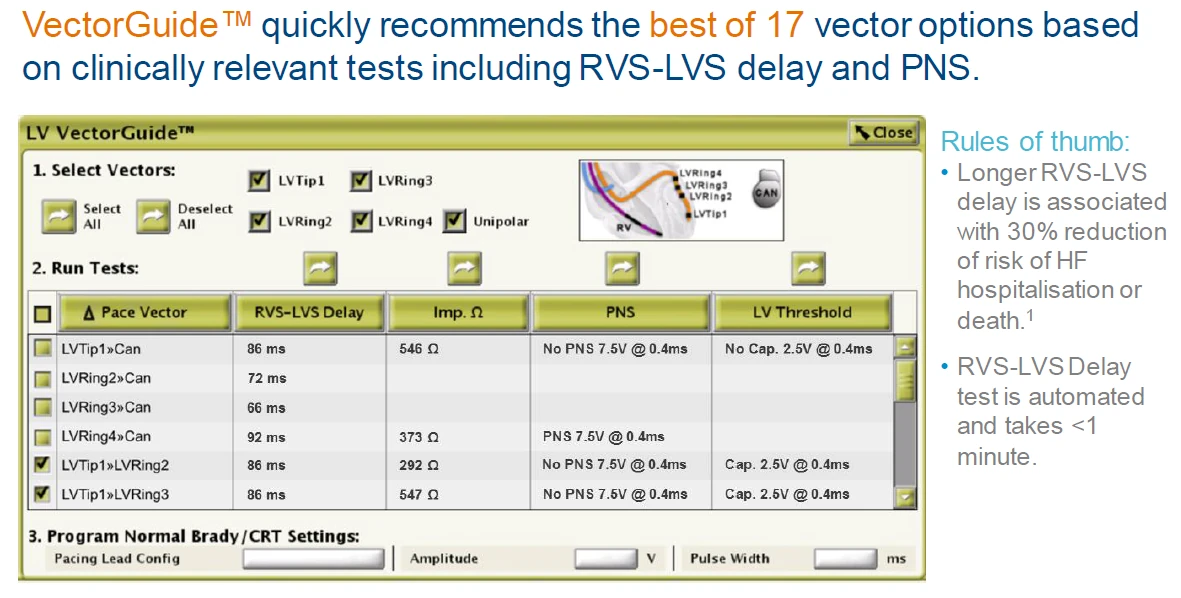
- Here is the vector change: Pacing Output, Left Ventricular, a fixed 7.5 V @ 0.8 ms (3 V above the threshold), and Leads Configuration LVRing4>>Can (ring 4 to the can) for pacing, LVTip1>>LVRing2 for sensing. At the office visit the LV was moved to LVTip1>>LVRing2, which captures at 1.6 V
- LV pace impedance of the first report over 6 months, on LVRing4>>Can: 540-730 Ω, stable: normal at the time
- Presenting EGM of the first report: the same normal BiV pacing (AS 880-888 ms, LVP 0, RVP), on the old vector. The paced LV complex differs from the latest report: the LV was paced from another electrode
Points to remember
- Each LV pacing vector has its own impedance. After a change of vector the trend steps to a new, stable level (here about 600 Ω before, about 1700 Ω after): that is not a lead fault
- Before suspecting the lead, find out what happened on the day of the jump: an office visit, a programming mark (P) on the trends, a new LV configuration in the settings
- A lead problem looks different: a jump with no reprogramming, unstable values, a rising threshold, or noise on the LV channel
- A high LV output drains the battery: a fixed 7.5 V @ 0.8 ms left 5 months to explant 33 months after implant. On a vector capturing at 1.6 V the output fell to 2.5 V, and the estimate rose to 1 year
- With a fixed LV output the remote report gives no LV threshold, and here it had not been measured since just after implant. A high LV threshold is a reason to test the other vectors of a quadripolar lead
Summary
- The LV pacing impedance almost triples overnight after an office visit: not a lead fault, but a new LV pacing vector with a much lower threshold, which also gives the battery a longer life
Clinical pearl
Each LV vector has its own impedance: a jump right after an office visit points first to a new pacing vector, not to a lead fault. Check what was programmed that day before suspecting the lead.
Practice out loud
Just describe the tracing. What do you think is going on? Describing the numbers can help.
00:00
0%
—
From Boston Scientific CRT — clinical cases by M. Strik. Published by Cardiocases. Every numbered marker on a recording is explained in the list beneath it; tap a marker on the trace or an entry in the list.