
Chapter 2 · LV impedance · Case 1
LV pacing impedance climbing after implant
Patient and episode
Patient
- MOMENTUM X4 CRT-D with a quadripolar LV lead; DDD 60-130 bpm, BiV pacing, LV offset 0 ms; LV paced LVRing2>>Can at a fixed 3.5 V @ 0.4 ms
- Remote LATITUDE transmission 3 months after implant; the last in-office check was just after implant. How is the LV lead doing?
The recording
Tap a number on the trace, or an entry in the list below
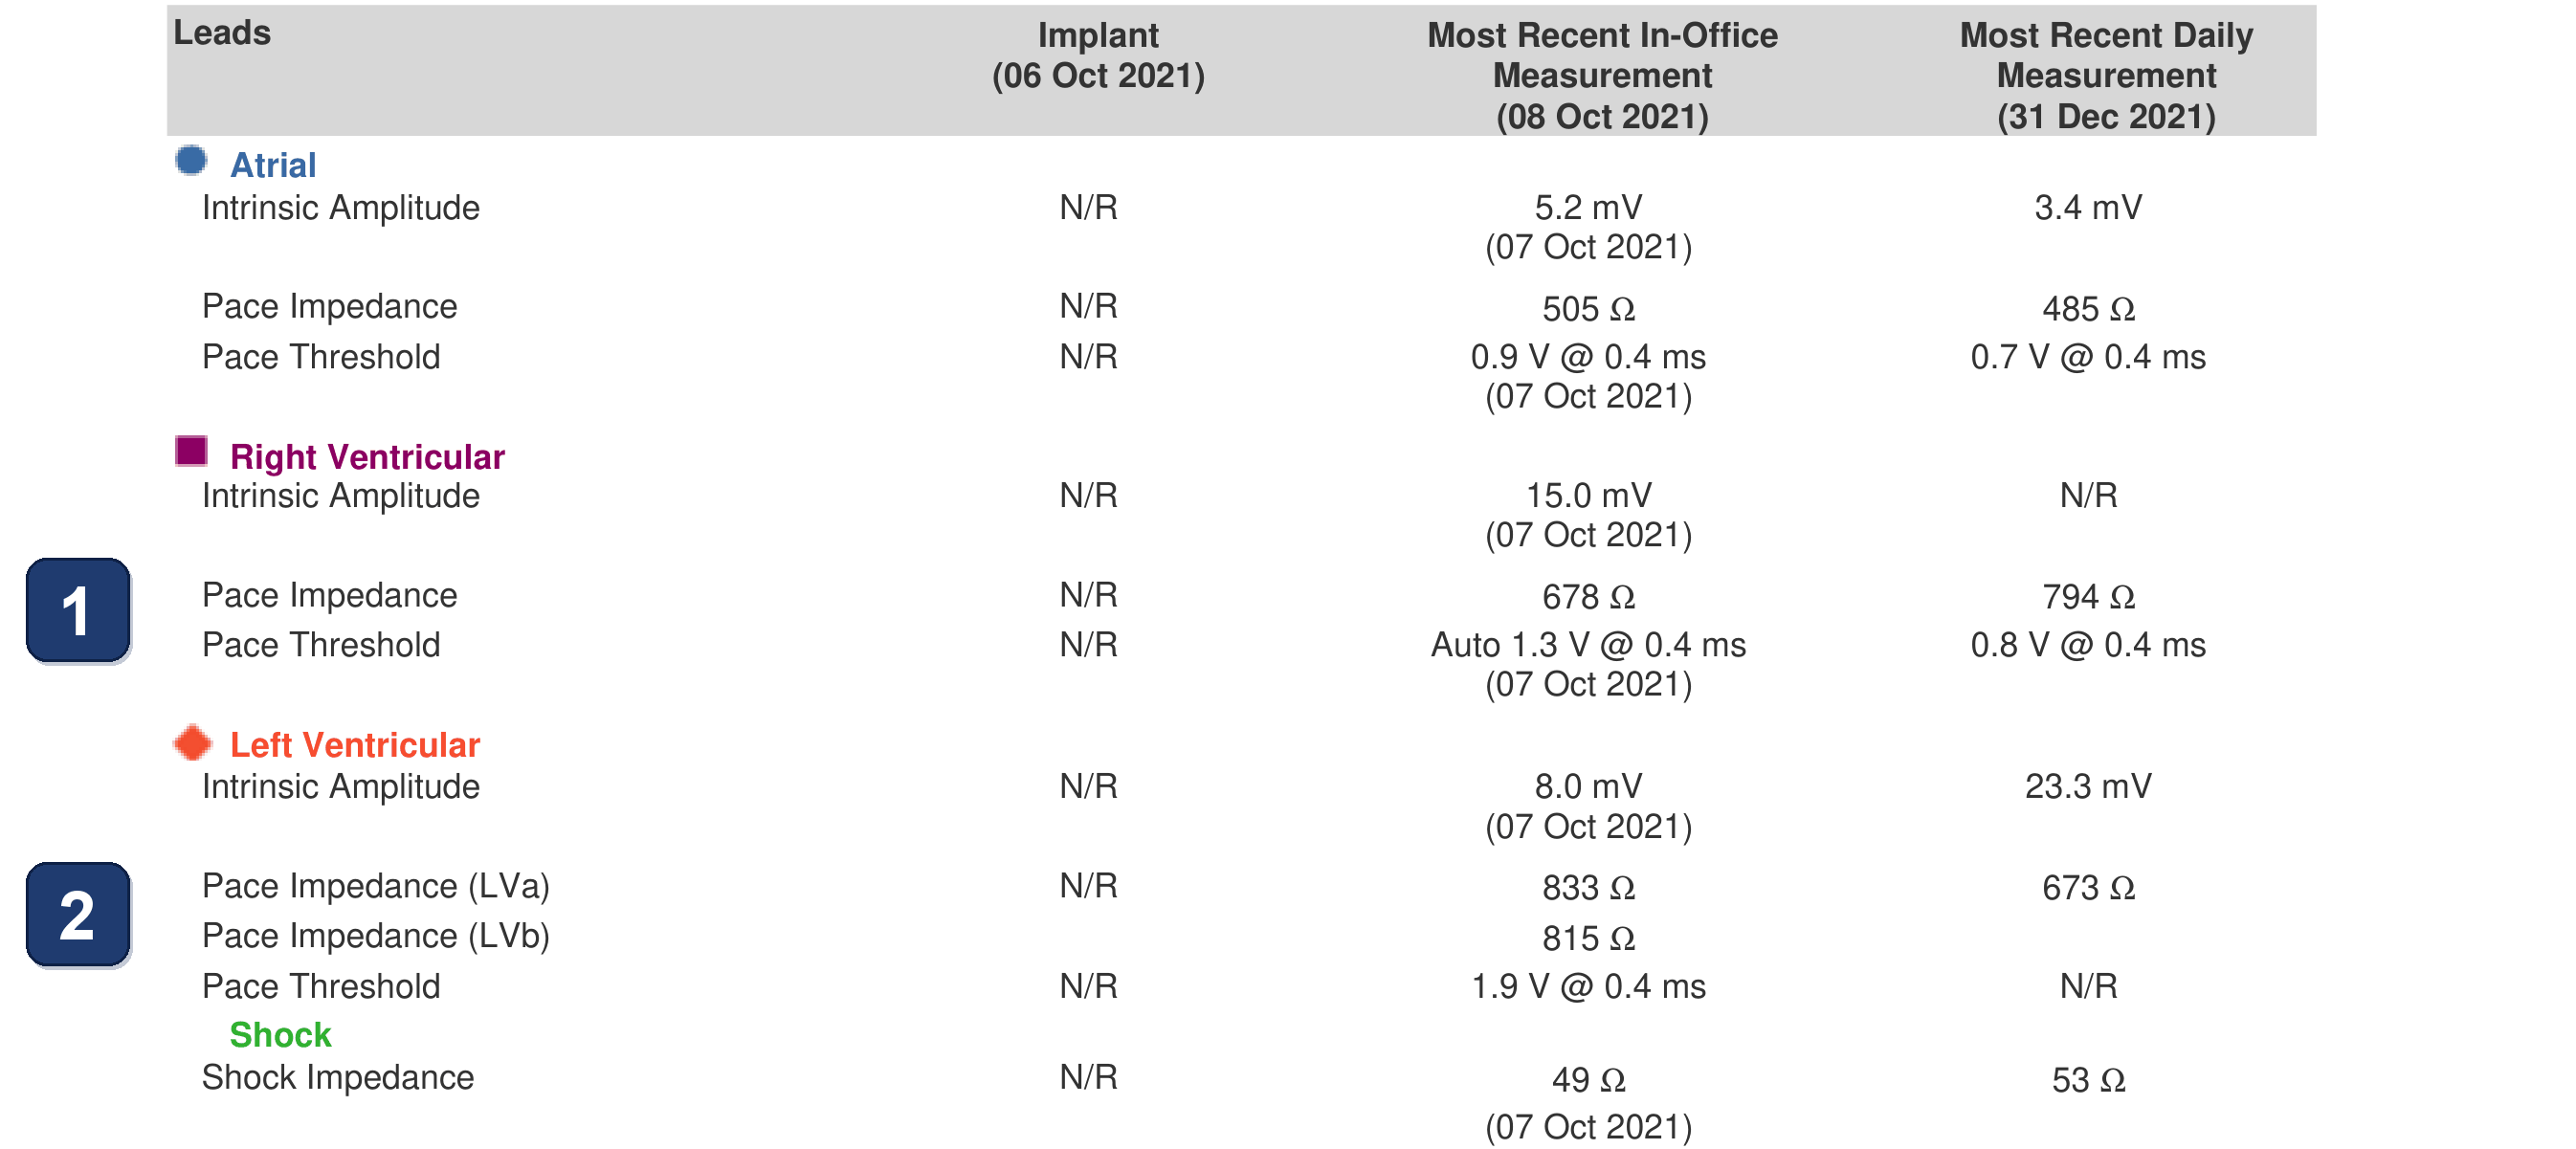
- Lead table of the remote report, 3 months after implant: no implant values (N/R), the in-office check just after implant, and the last daily measurement, the day before the transmission. RV lead: pace impedance 678 → 794 Ω, threshold Auto 1.3 V → 0.8 V @ 0.4 ms
- LV lead: pace impedance 833 Ω in office, 673 Ω on the last daily measurement: read alone, a fall. LV threshold 1.9 V @ 0.4 ms in office, and no daily value (N/R)
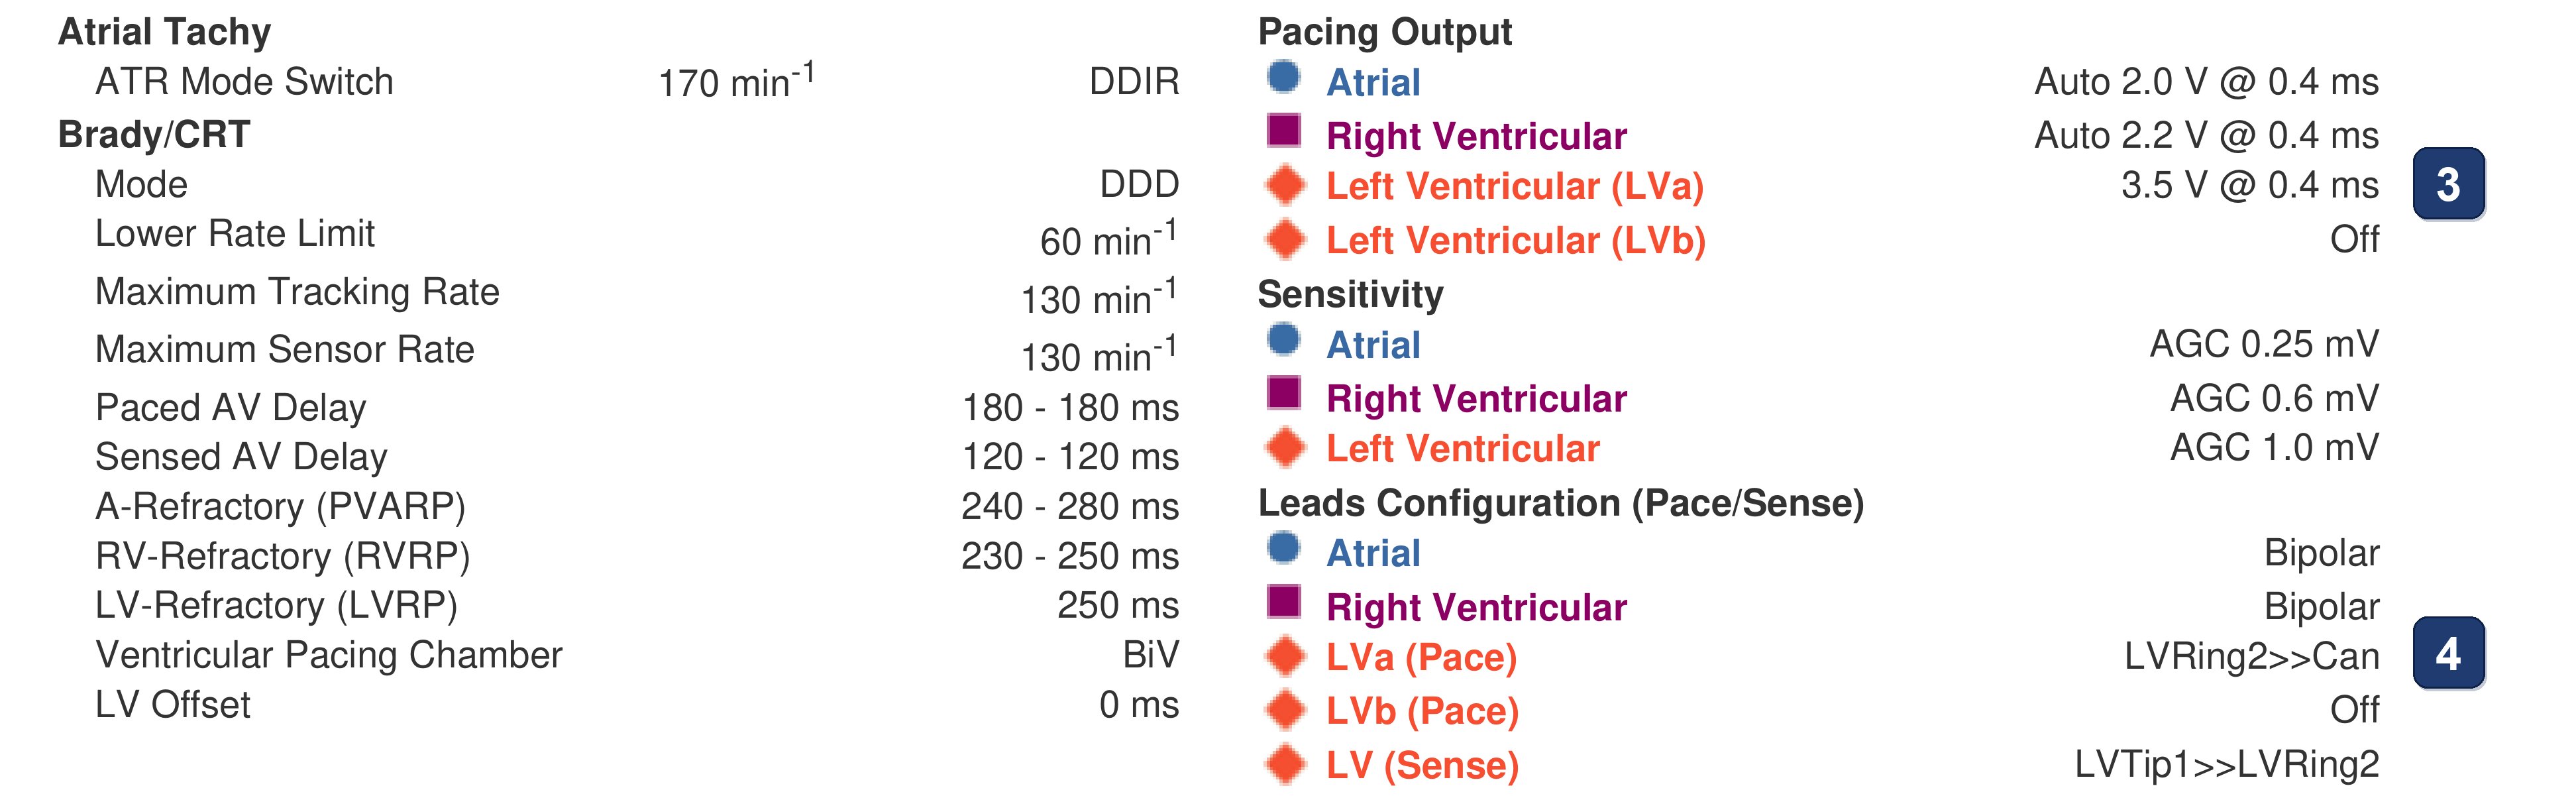
- Pacing output: the LV is fixed at 3.5 V @ 0.4 ms, while the atrium and the RV are Auto (2.0 and 2.2 V): PaceSafe LV does not set the LV output
- The LV paces LVRing2>>Can (ring 2 of the quadripolar lead to the can) and senses LVTip1>>LVRing2: the LV impedance is the impedance of that pacing vector
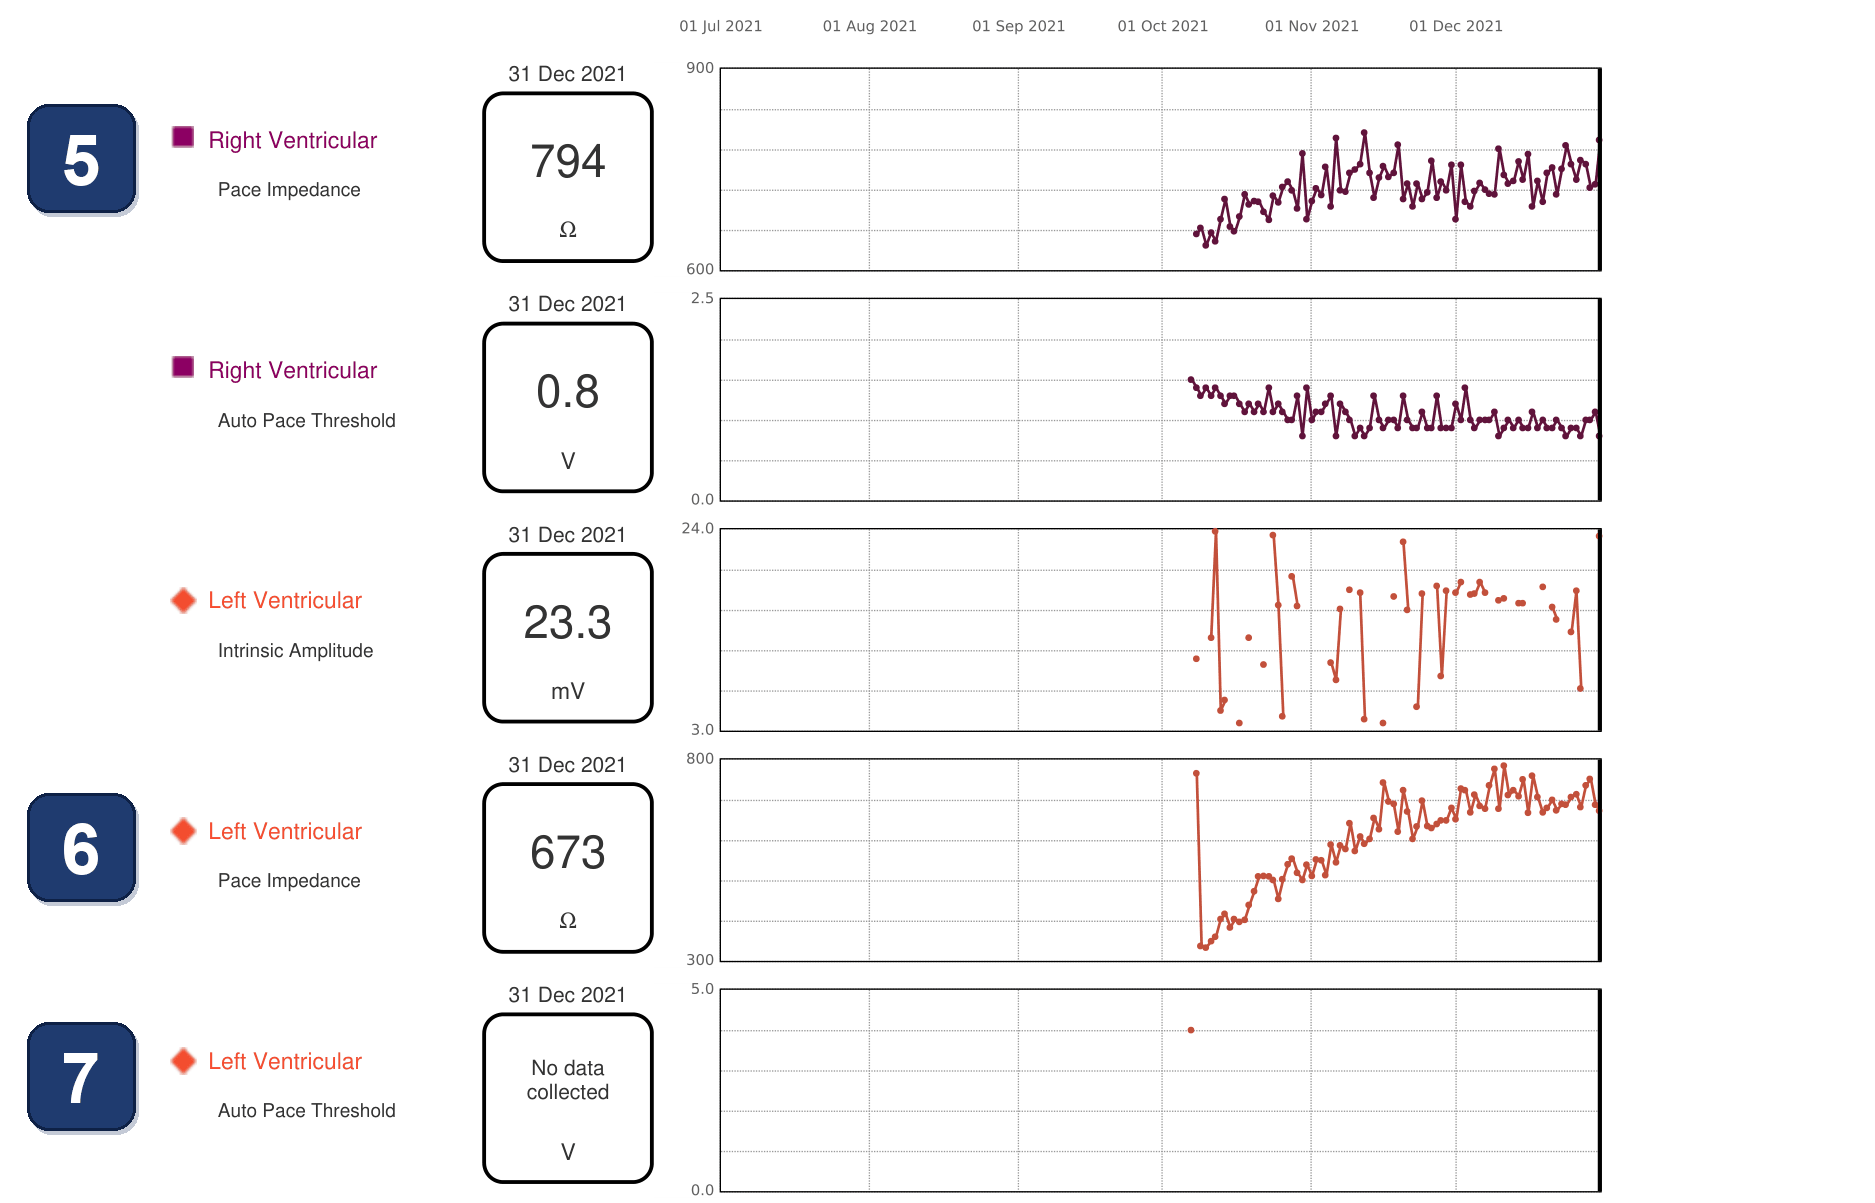
- RV trends, one value a day from the first days after implant (vertical lines: the 1st of each month): pace impedance 655 Ω at first, then a slow rise to 700-800 Ω (794 Ω on the last day); RV auto threshold 1.5 V, falling to about 0.8-1.1 V
- LV pace impedance: 765 Ω at the in-office check just after implant, 338 Ω the next day. The LV pacing vector was changed at that check because another vector had a better threshold: that explains the drop. From there a slow, steady climb: about 400 Ω a week later, 550 Ω a month after implant, 600-780 Ω from the 6th week (673 Ω on the last day), with no jump and no lead alert. The small regular waves come from the measurement: the impedance is checked every 21 hours, so at a different time each day. The LV lead lies in a coronary side vein, sometimes thrombosed, on epicardial tissue where fat or fibrosis forms: this may explain such impedance changes without any conductor fracture
- LV auto threshold: a single value, about 4.0 V the day after implant (the “LV Auto” test of the event list, on the first vector), then “No data collected”: the LV threshold is not followed remotely; the last one is the in-office 1.9 V @ 0.4 ms, for a fixed 3.5 V output
Points to remember
- In the first months after implant the pacing impedance may rise slowly and steadily, as here (LV about 340 → 700 Ω in 3 months, RV 655 → 794 Ω). The LV lead sits in a coronary side vein, sometimes thrombosed, against epicardial tissue where fat or fibrosis forms: the impedance can change without any conductor fracture. With no jump, no lead alert and values within range, the lead works
- A lead problem looks different: a sudden jump or drop, a value out of range, or a rising threshold
- Read the trend, not two numbers: the lead table compares the in-office value (833 Ω) with the last daily one (673 Ω) and suggests a fall, while the daily trend shows a steady rise from 338 Ω. Its small regular waves come from a measurement every 21 hours, at a different time each day
- An impedance belongs to one pacing vector: here the LV vector was changed at the check just after implant, for a better threshold, hence the drop. Compare values only on the same vector, and check what was programmed on the day of any step
- With a fixed LV output the remote report gives no LV threshold, so the impedance trend is the only daily check of the LV lead. PaceSafe LV set to Daily Trend would add a daily threshold without changing the output
Summary
- After a change of LV pacing vector just after implant (a better threshold, hence an impedance drop), the LV pacing impedance doubles in 3 months, from about 340 to 700 Ω, slowly and steadily, while the RV impedance also climbs. No jump, no lead alert, values in range: the lead works
Clinical pearl
Read the impedance trend, not two numbers: a slow, steady rise within range in the months after implant does not mean a lead problem; a sudden jump or drop needs an explanation.
Practice out loud
Just describe the tracing. What do you think is going on? Describing the numbers can help.
00:00
0%
—
From Boston Scientific CRT — clinical cases by M. Strik. Published by Cardiocases. Every numbered marker on a recording is explained in the list beneath it; tap a marker on the trace or an entry in the list.