
Chapter 1 · Counters · Case 1
Counting and diagnosis of ventricular fibrillation
Patient
- A 66-year-old man, implanted with a dual-chamber defibrillator for secondary prevention due to ischemic heart disease in the absence of infarction, with an ejection fraction of 27%, presenting initially with decompensated heart failure with narrow QRS complexes. The patient came in for a consultation because he had experienced an electric shock preceded by palpitations and presyncope.
Summary screen
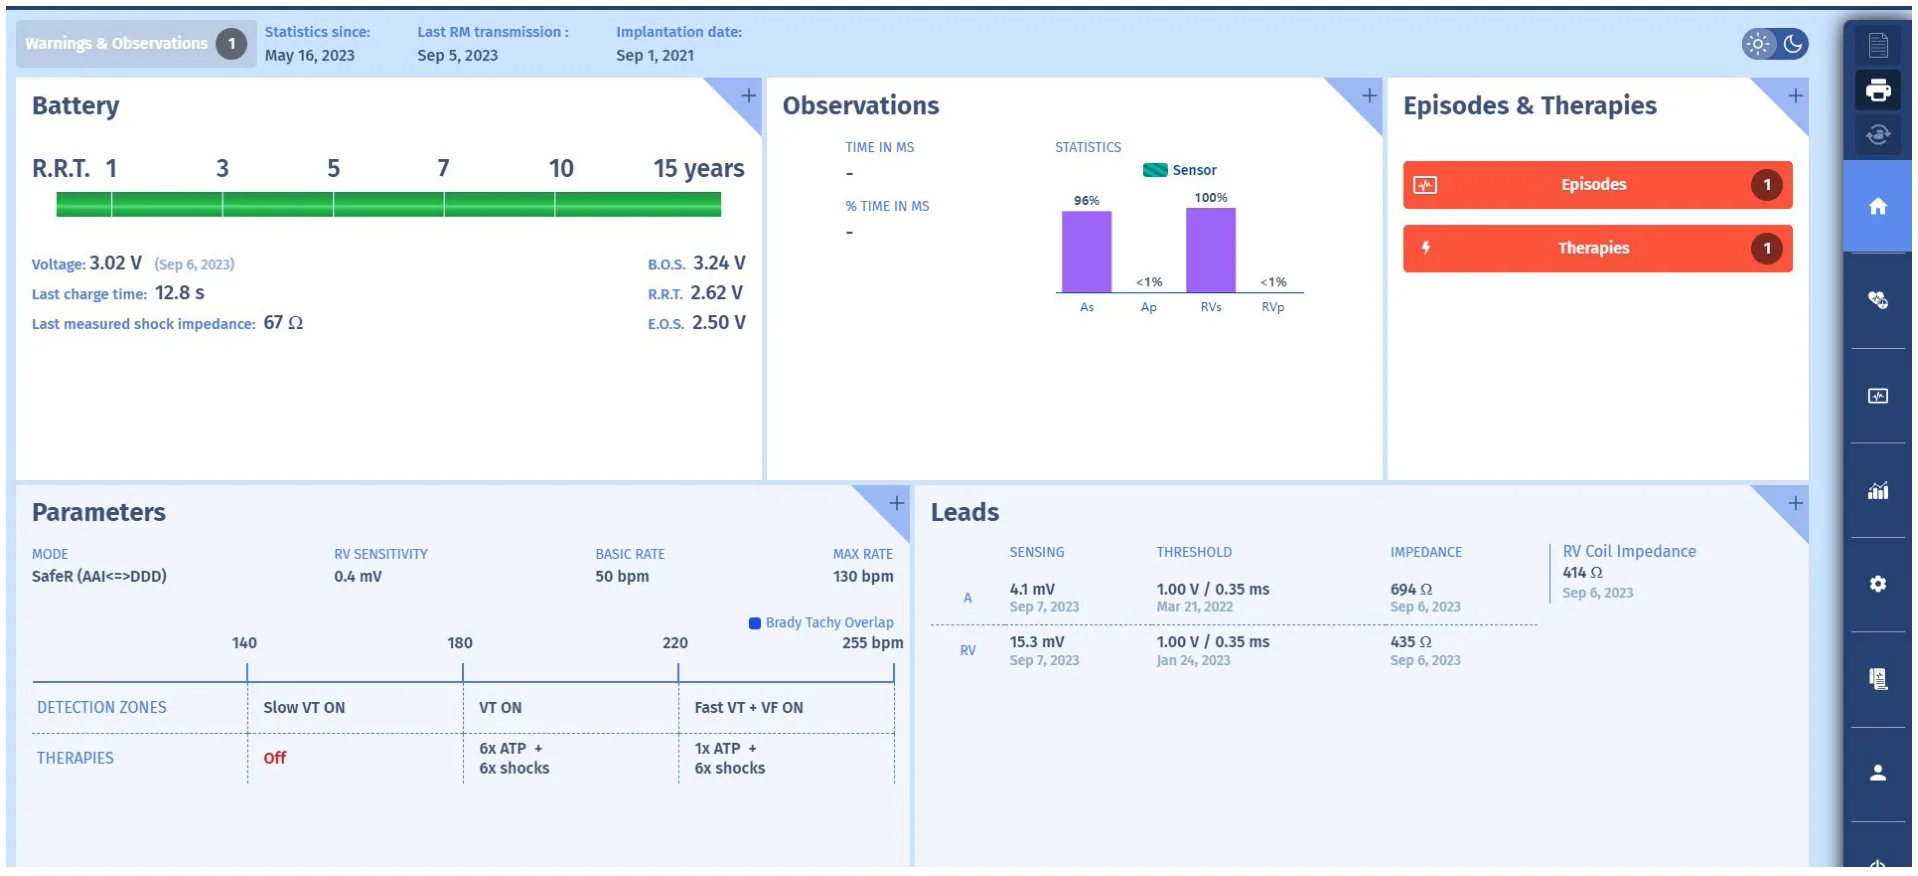
Here is the first screen when interrogating the defibrillator:
Your turn
What is your opinion? (multiple answers possible)
- The battery is new
- The impedance of the shock electrode is not satisfactory
- The programming of the therapies is in keeping with the recommendations
- There appears to be a problem with the atrial lead.
- There is a high probability that certain atrial arrhythmias are not detected.
Interpretation
- At interrogation, and after verification of the leads, we can see that they function perfectly, that the battery is new, that the patient has received at least one shock since the shock impedance was measured, with a value of 67 Ohm. The anti-bradycardia programming attempts to abide to AV conduction by the SafeR-R mode; the ventricular pacing rate is <1%. For tachycardias, a Slow VT zone, from 140 to 180/min, is a monitoring zone; between 180 and 220, a VT zone with therapies comprised of 6 ATPs and 6 shocks (all at maximum energy of 42 Joules not visible on this screen); above 220/ min, a Fast VT zone + VF, with up to 255/min, 1 pre-shock burst if the tachycardia is stable, followed by maximum energy shocks, and maximum energy shocks alone beyond 255/min. The programming is in keeping with recommendations.
- In the Observations section, there was no mode switch, suggesting the absence of atrial rhythm disorders, especially since the atrial detection in sinus rhythm is very good (4.1mV), suggesting a good detection of AF when occurring (simple presumption since there is limited correlation between the amplitude of the sinus signals and the atrial arrhythmia signals).
- In the Episodes & Therapies section, we can that there has been 1 episode with therapies. On the old user interface, there would have been more information presented in the form of a table. But for the sake of clarity, it has been decided to consolidate this information and present the details elsewhere.
When we click on one of those red buttons (or when we go to the “episodes” screen we will access the following episode list. The list of memorized episodes appears with their respective type, date, duration and therapy applied.
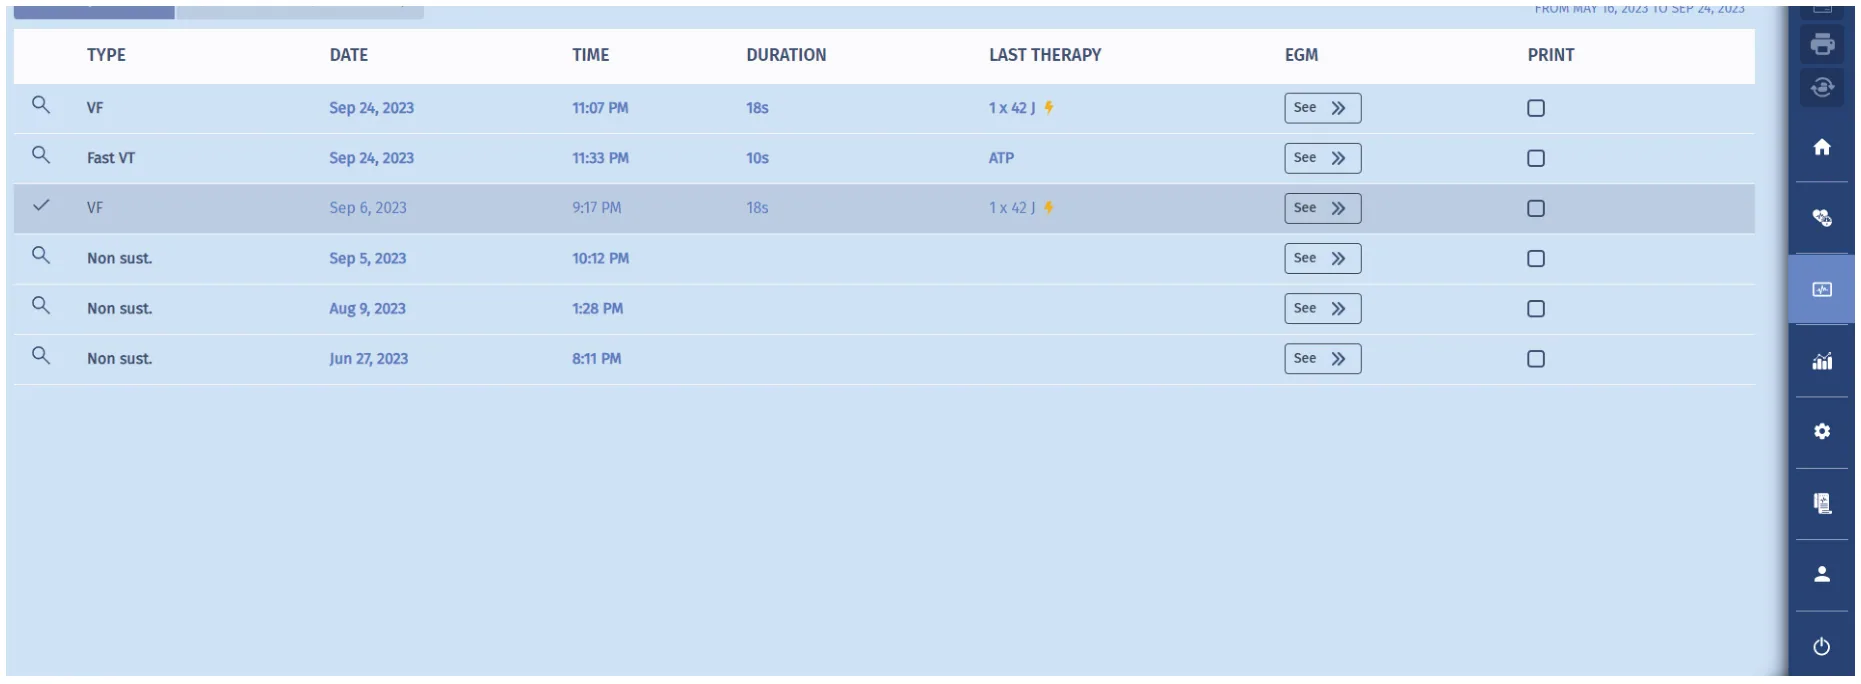
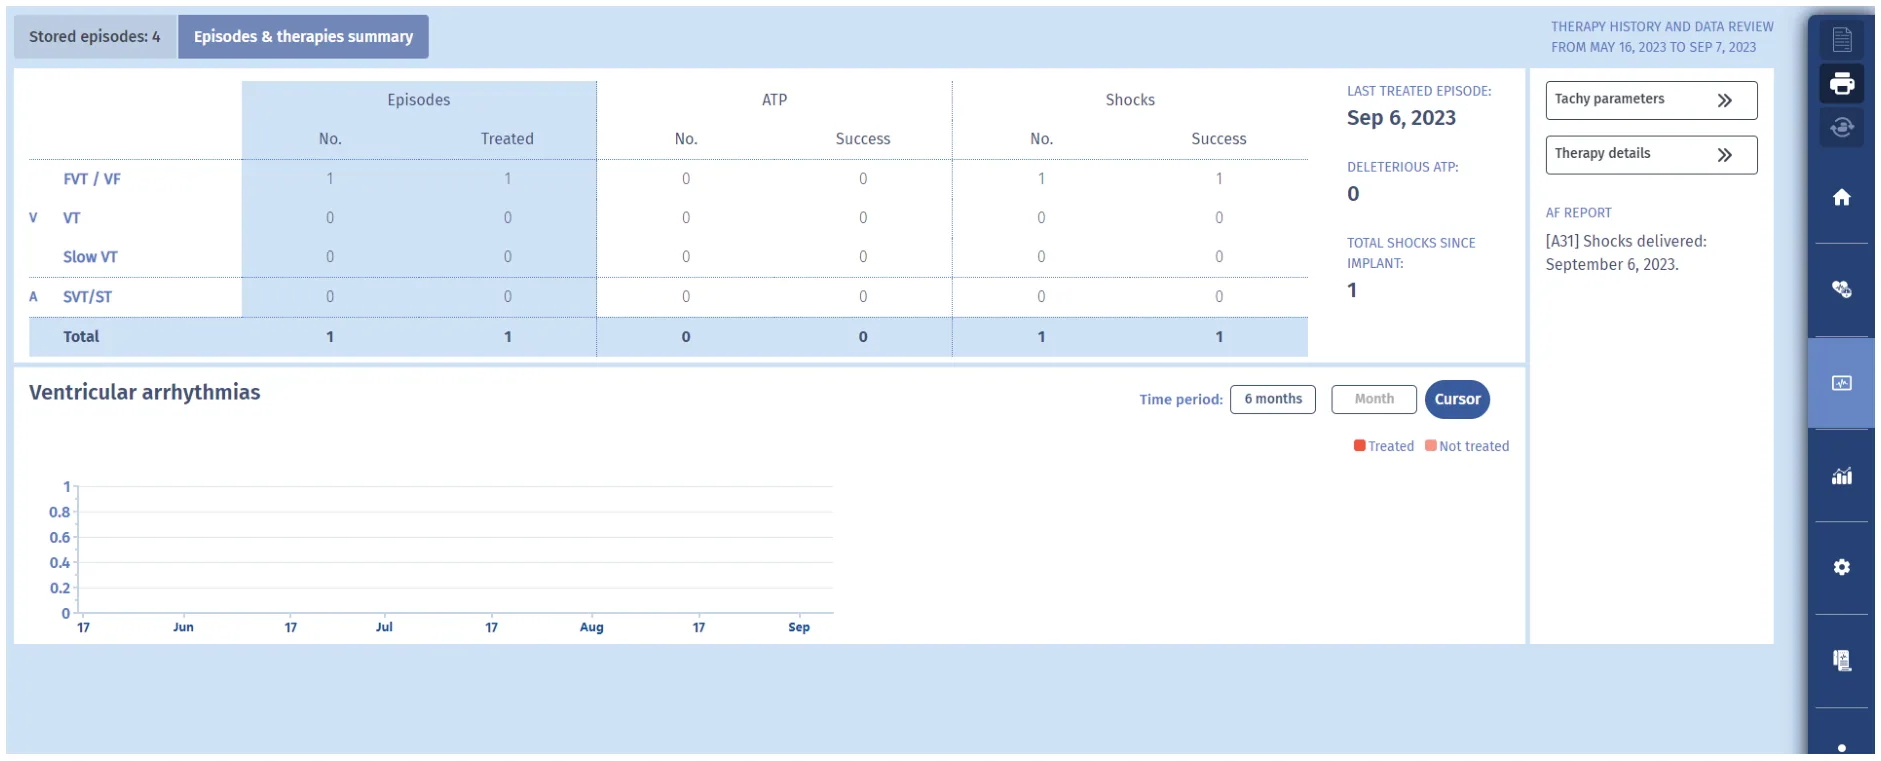
When we click on “Episodes and Therapies summary”, we can observe a table with episodes and therapys. We can see that there has been 1 VF episode with therapy.
Episode review
Let’s review the most recent episode, diagnosed as VF, resulting in a shock. We will get a combined screen showing the EGM corresponding with the highlighted area on the tachogram displayed below.
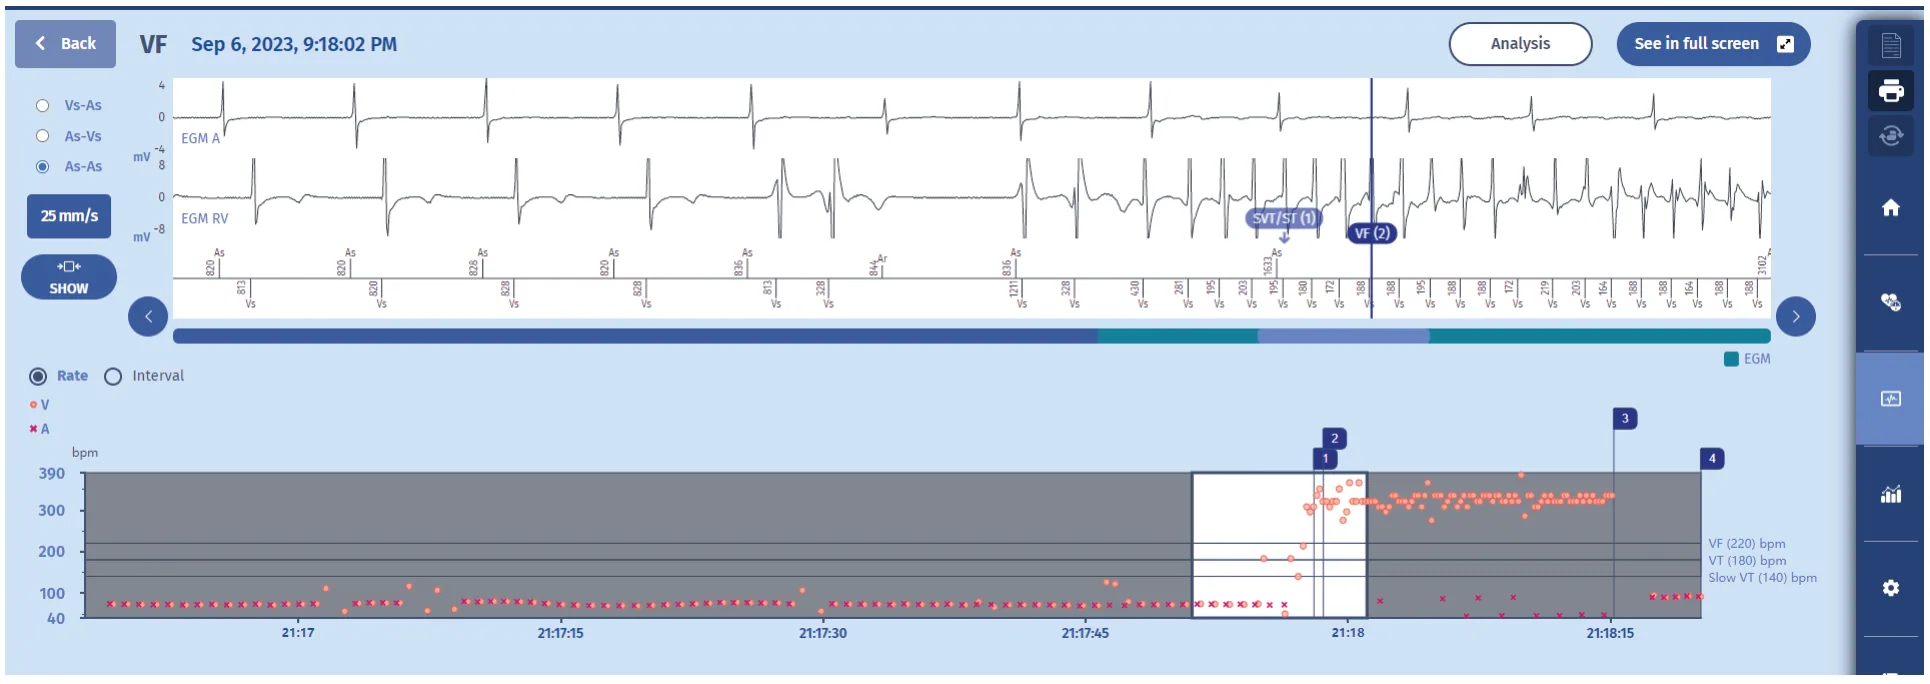
The interval plot reveals the following elements:
- On the right of the graph, the following zones are noted: a monitoring Slow VT zone from 140 to 180/min, a VT zone from 180 to 220/min with bursts, ramps and shocks, and VF above, with a FVT zone from 220 to 255/min with 1 burst followed by maximum shocks.
- Initially, the rhythm is 1:1 in a Slow rhythm zone with some premature ventricular complexes (the higher orange dots) and compensatory pauses (lower orange dots).
- Suddenly, a chaotic tachycardia occurs in the VF zone. The diagnosis of VF was made (at marker 2), after which a 41.8 Joule shock was delivered (marker 3) with immediate effectiveness.
- Return to slow rhythm. The episode is terminated (marker 4).
Electrogram: beginning
While the interval plot allows for a quick overview of the episode with possibility of making the diagnosis in most cases, it is essential to analyze the electrogram (EGM) to verify proper functioning of the ICD. The EGM can be expanded by clicking on « See in full screen ».
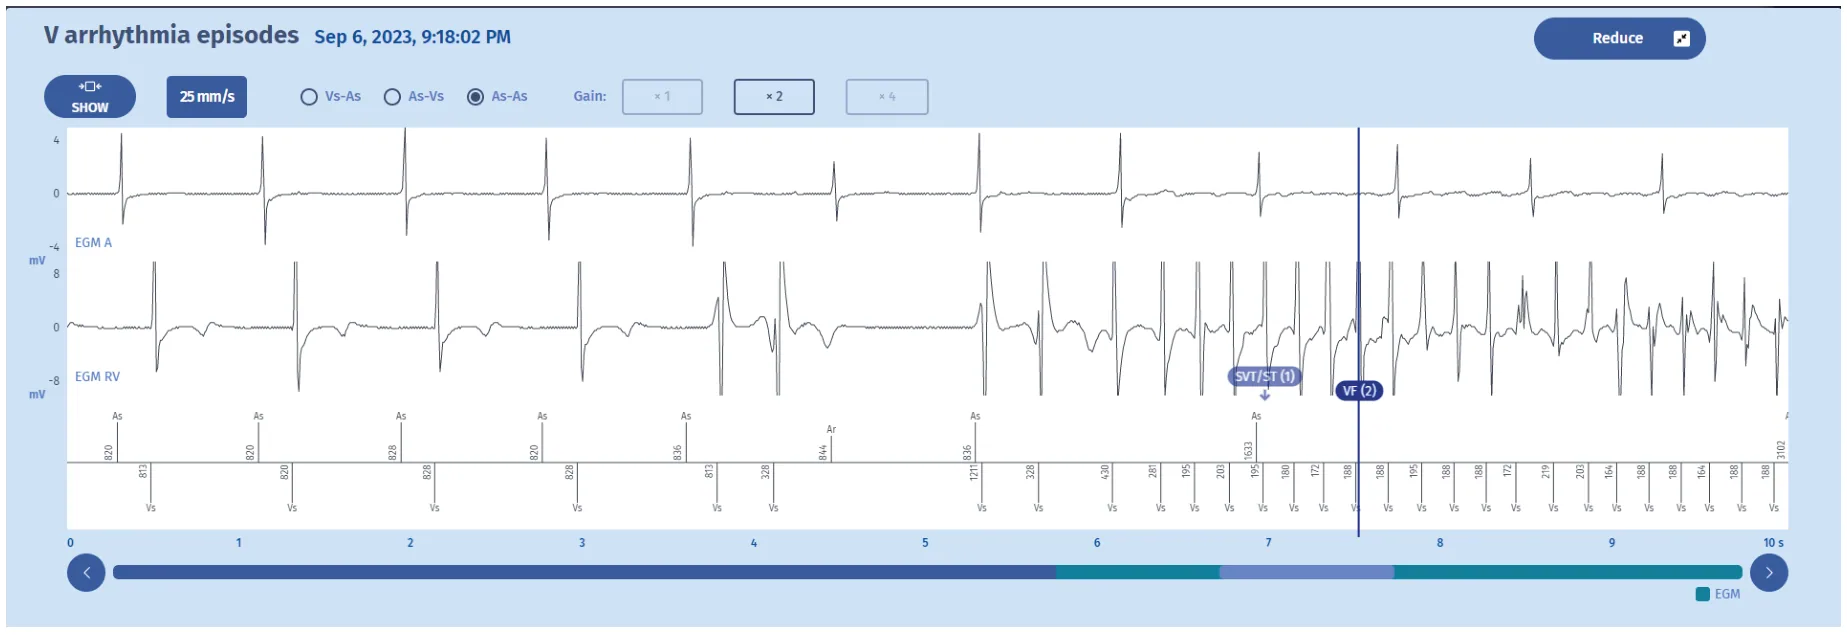
Tracings: The tracing at the top entitled EGM A is the atrial electrogram, the tracing underneath entitled EGM RV is the ventricular electrogram, lastly, at the bottom, the atrial markers above the line and ventricular markers below, along with the time intervals. The gain can be changed at the top (now set at X 2). The running speed can also be changed, ranging from 12.5 to 100 mm/sec.
The EGM shows the following elements
- An intrinsic rhythm with spontaneous atrioventricular conduction rhythm at baseline;
- A few ventricular extrasystoles which seem to be associated with the onset of a polymorphic tachycardia above 220/min, perfectly detected, with a slow and regular atrial rhythm, and small amplitude signals on the atrial channel which are far-field signals of ventricular origin and not detected by the atrial chain;
- After 6 out of 8 cycles in the VT zone, the diagnosis of SVT/ST is made (marker 1); this is often seen in VF episodes and is caused by the “warming” up of many ventricular arrythmias. The combination of fast cycles (PVCs and the onset of VF) and slow cycles (compensatory pauses or differences in cycles often seen during “warming up” period) results in the VT criteria being fullfilled before the VF criteria. As the rythm is unstable, it is considered SVT by the discrimination algorithm, therefore we see a first marker SVT/ST, rather than VT of VF.
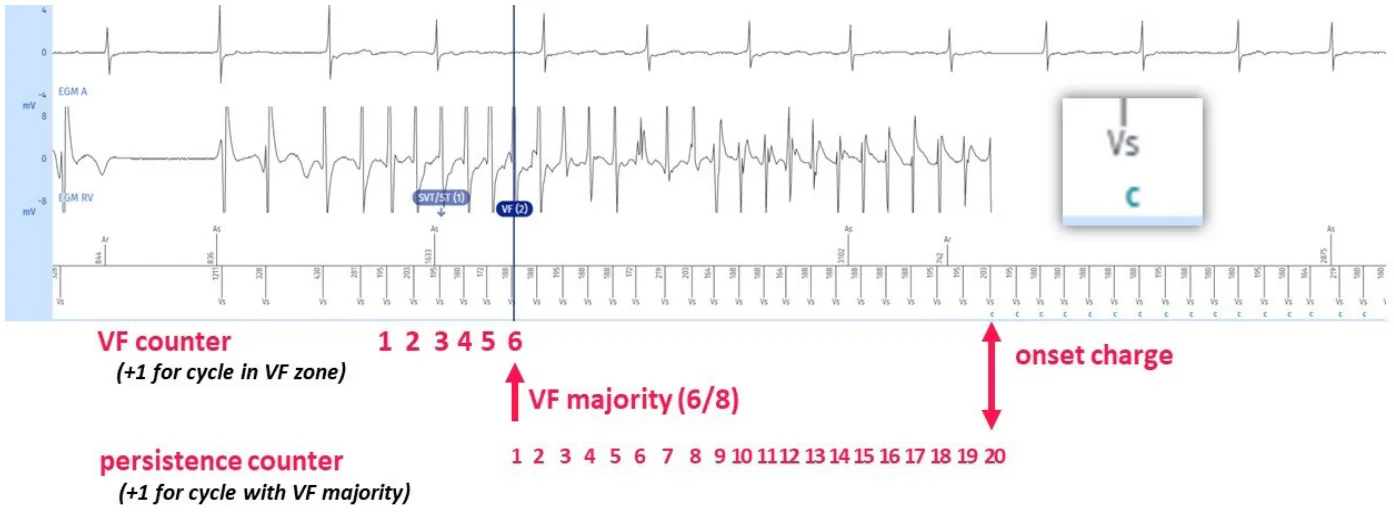
- After a majority of 6 out of 8 cycles in the VF zone, the diagnosis of VF is made shown by the marker VF (2). It should be pointed out, even before the course on discrimination, that the discrimination criteria (PARAD+) are not active because it is the VF zone.
- After diagnosis of VF, therapys are not directly delivered as we want to give the tachycardia the chance to self-terminate. The tachycardia needs to complete the persistence counter before therapies are delivered. After 20 persistence cycles, as programmed (and as recommended), during which the diagnosis of VF is confirmed at each cycle, according to the 6/8 majority, the capacitor charges (« C »). Indeed, no burst was triggered because the rate is above the 220 – 255/min zone. (If the tachycardia had been within this aforementioned zone, and if it had been stable, then a burst would have been triggered. If the tachycardia had been within this zone but conversely unstable, then an immediate shock would have been delivered without a prior burst).
Electrogram: end
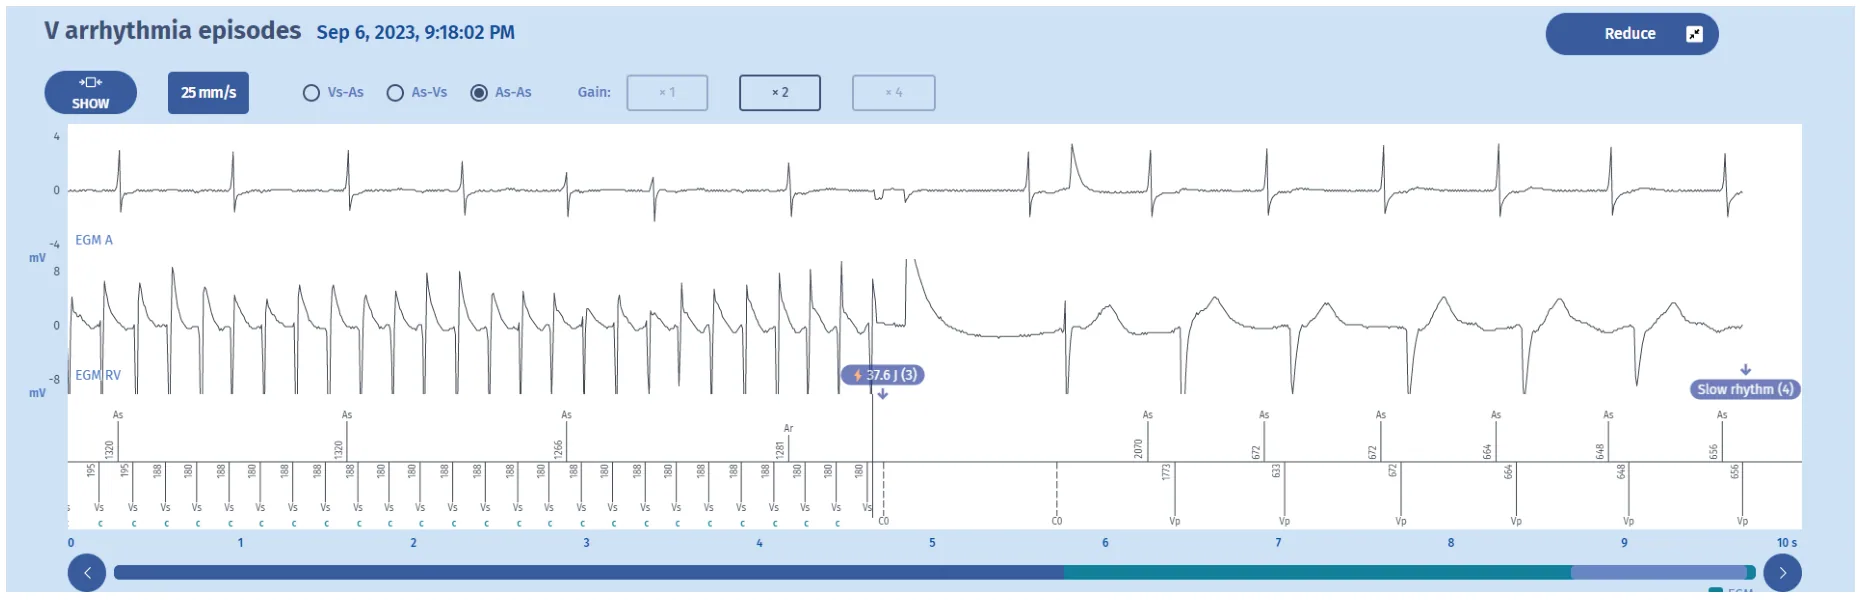
- Once charged, the defibrillator sends a shock on the next cycle which is in the VF zone; shown by the marker: 37.6J (3).
- After the shock, there is a 1-second blanking period (between C0 markers). After six cycles out of tachycardia zones the Slow rhythm majority is met (6/8) and the episode is terminated.
Comments
The EGMs show normal functioning of the defibrillator. The counting of the events is carried out as follows:
- Each ventricular cycle detected outside refractory periods is classified as: Slow, VT or VF, depending on the programming of the tachycardia zones.
- In a sliding window of 8 cycles and for each cycle, the device classifies RR cycles with a 16-ms margin in a histogram. Paced cycles do not enter into the constitution of the histogram.
- In the present case, 75% of the 8 cycles, hence 6, must be in the VF zone for the diagnosis to be established. For a therapy to be triggered, it is necessary that the persistence of the programmed number of cycles is fulfilled (in this instance 20 cycles, according to the recommendations), with the VF majority detected for each cycle. The last 4 cycles determine the initiation of therapy due to FVT or VF: each of the last 4 cycles are analysed and if any of the latter is in the VF zone above the FVT zone, the assigned therapy will be a 42 J shock (depending on the programming), and the charge of the capacitors begins.
- All tachycardia cycles are in the VF zone during the charge which is therefore continuous. It is on the ensuing cycle which follows the end of the charge and which is in VF zone that the shock is delivered.
- After the shock, 6 out of 8 cycles are in the Slow zone, the rhythm is deemed slow and the episode is terminated.
A systematic approach must be used to read the follow-up data:
- Make sure that the leads are working properly and repeat the tests systematically. Leads in perfect condition report reliable signals to the defibrillator and the stored data are interpretable. If the leads do not work properly, the reading of the memories will need to be with much more caution.
- Make sure you analyse the programming of the device properly to correctly interpret the memories. The device only records events according to what it is asked to do and record !
- To correclty interpret EGMs, a sound knowledge of the programmed algorithms is required.
Practice out loud
Just describe the tracing. What do you think is going on? Describing the numbers can help.
—
From Implantable Cardioverter Defibrillator — Clinical cases from patients with MicroPort™ ICDs by M. Strik, A. Thiyagarajah, S. Ploux, P. Bordachar, P. Ritter. Published by Cardiocases. Each case is a question on real device interrogations: pick your answer, check it, then read the authors’ interpretation. Tap any figure to open it full screen.