Optimization of the AV delay in a recipient of Sorin defibrillator
Tracing
Manufacturer Microport CRM
Device CRT
Field AV & VV delays optimization
N° 7
Patient
This 63-year-old man received a Microport CRM-Sorin SonR triple chamber defibrillator in the context of ischemic cardiomyopathy with left bundle branch block. The memories and variations in programmed AV delay were analyzed according to the SonR algorithm.
Graph and trace
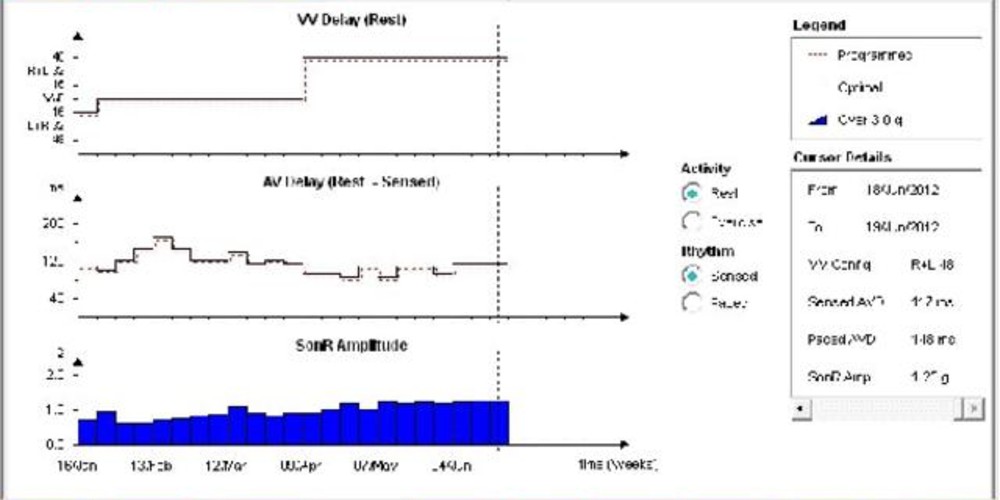
- optimization of the sensed AV delay at rest, during the follow-up since the device implantation. This figure displays the variations in the optimization of the VV delay (strictly at rest) and of the sensed AV delay at rest, as well as the variations in the Son-R amplitude. The Son-R is measured and optimized on weekly basis. A trend is apparent toward a progressive increase in the Son-R signal amplitude.
- this figure displays the variations in the optimization of the VV delay and of the paced AV delay at rest, along with the variations in the Son-R signal amplitude.
- this figure displays the variations in the optimization of the VV delay and of the sensed AV delay during exercise, along with the variations in the Son-R signal amplitude.
- this figure shows the variations in the optimization of the VV delay and of the paced AV delay during exercise, along with the variations in the Son-R signal amplitude.
Other articles that may be of interest to you
EGM recordings


The Son-R signal is measured by a sensor embedded inside a dedicated atrial lead. Its nocturnal optimization, between Sunday and Monday, is based on a weekly, automatic test of 69 AV/VV delays combinations at rest and during exercise, optimizing thereby the sensed and paced AV delays and the resting VV delay. The VV delay optimization is based on a search for the ventricular activation sequence that produces the highest amplitude of the Son-R signal. The AV delay optimization is based on a more complex analysis of the curve of variations in the amplitude of the SonR signal depending of the AV delay, and on a search for the curve’s inflexion point, which, in human and animal models, was validated as the optimal AV delay.
In this responder to CRT, the temporal variations are apparent as a trend toward a progressive increase in the Son-R signal amplitude. The various curves also show the variations in optimal, paced and sensed AV delay, at rest and during exercise, and the variations in optimal resting VV delay. The changes in AV delay after an optimization from a previous measurement are limited to 20 ms (16 ms for the VV delay), explaining the small steps shown on the curves.